
Cohorts
This page describes Cohorts charts
Cohort analysis is a powerful tool for gaining insights into how users renew subscriptions and how well subscribers and revenue are retained over time.
The Cohorts section features two charts: one for subscribers and another for net revenue retention. Analyzing both charts provides a comprehensive view of subscriber behavior.
Overview
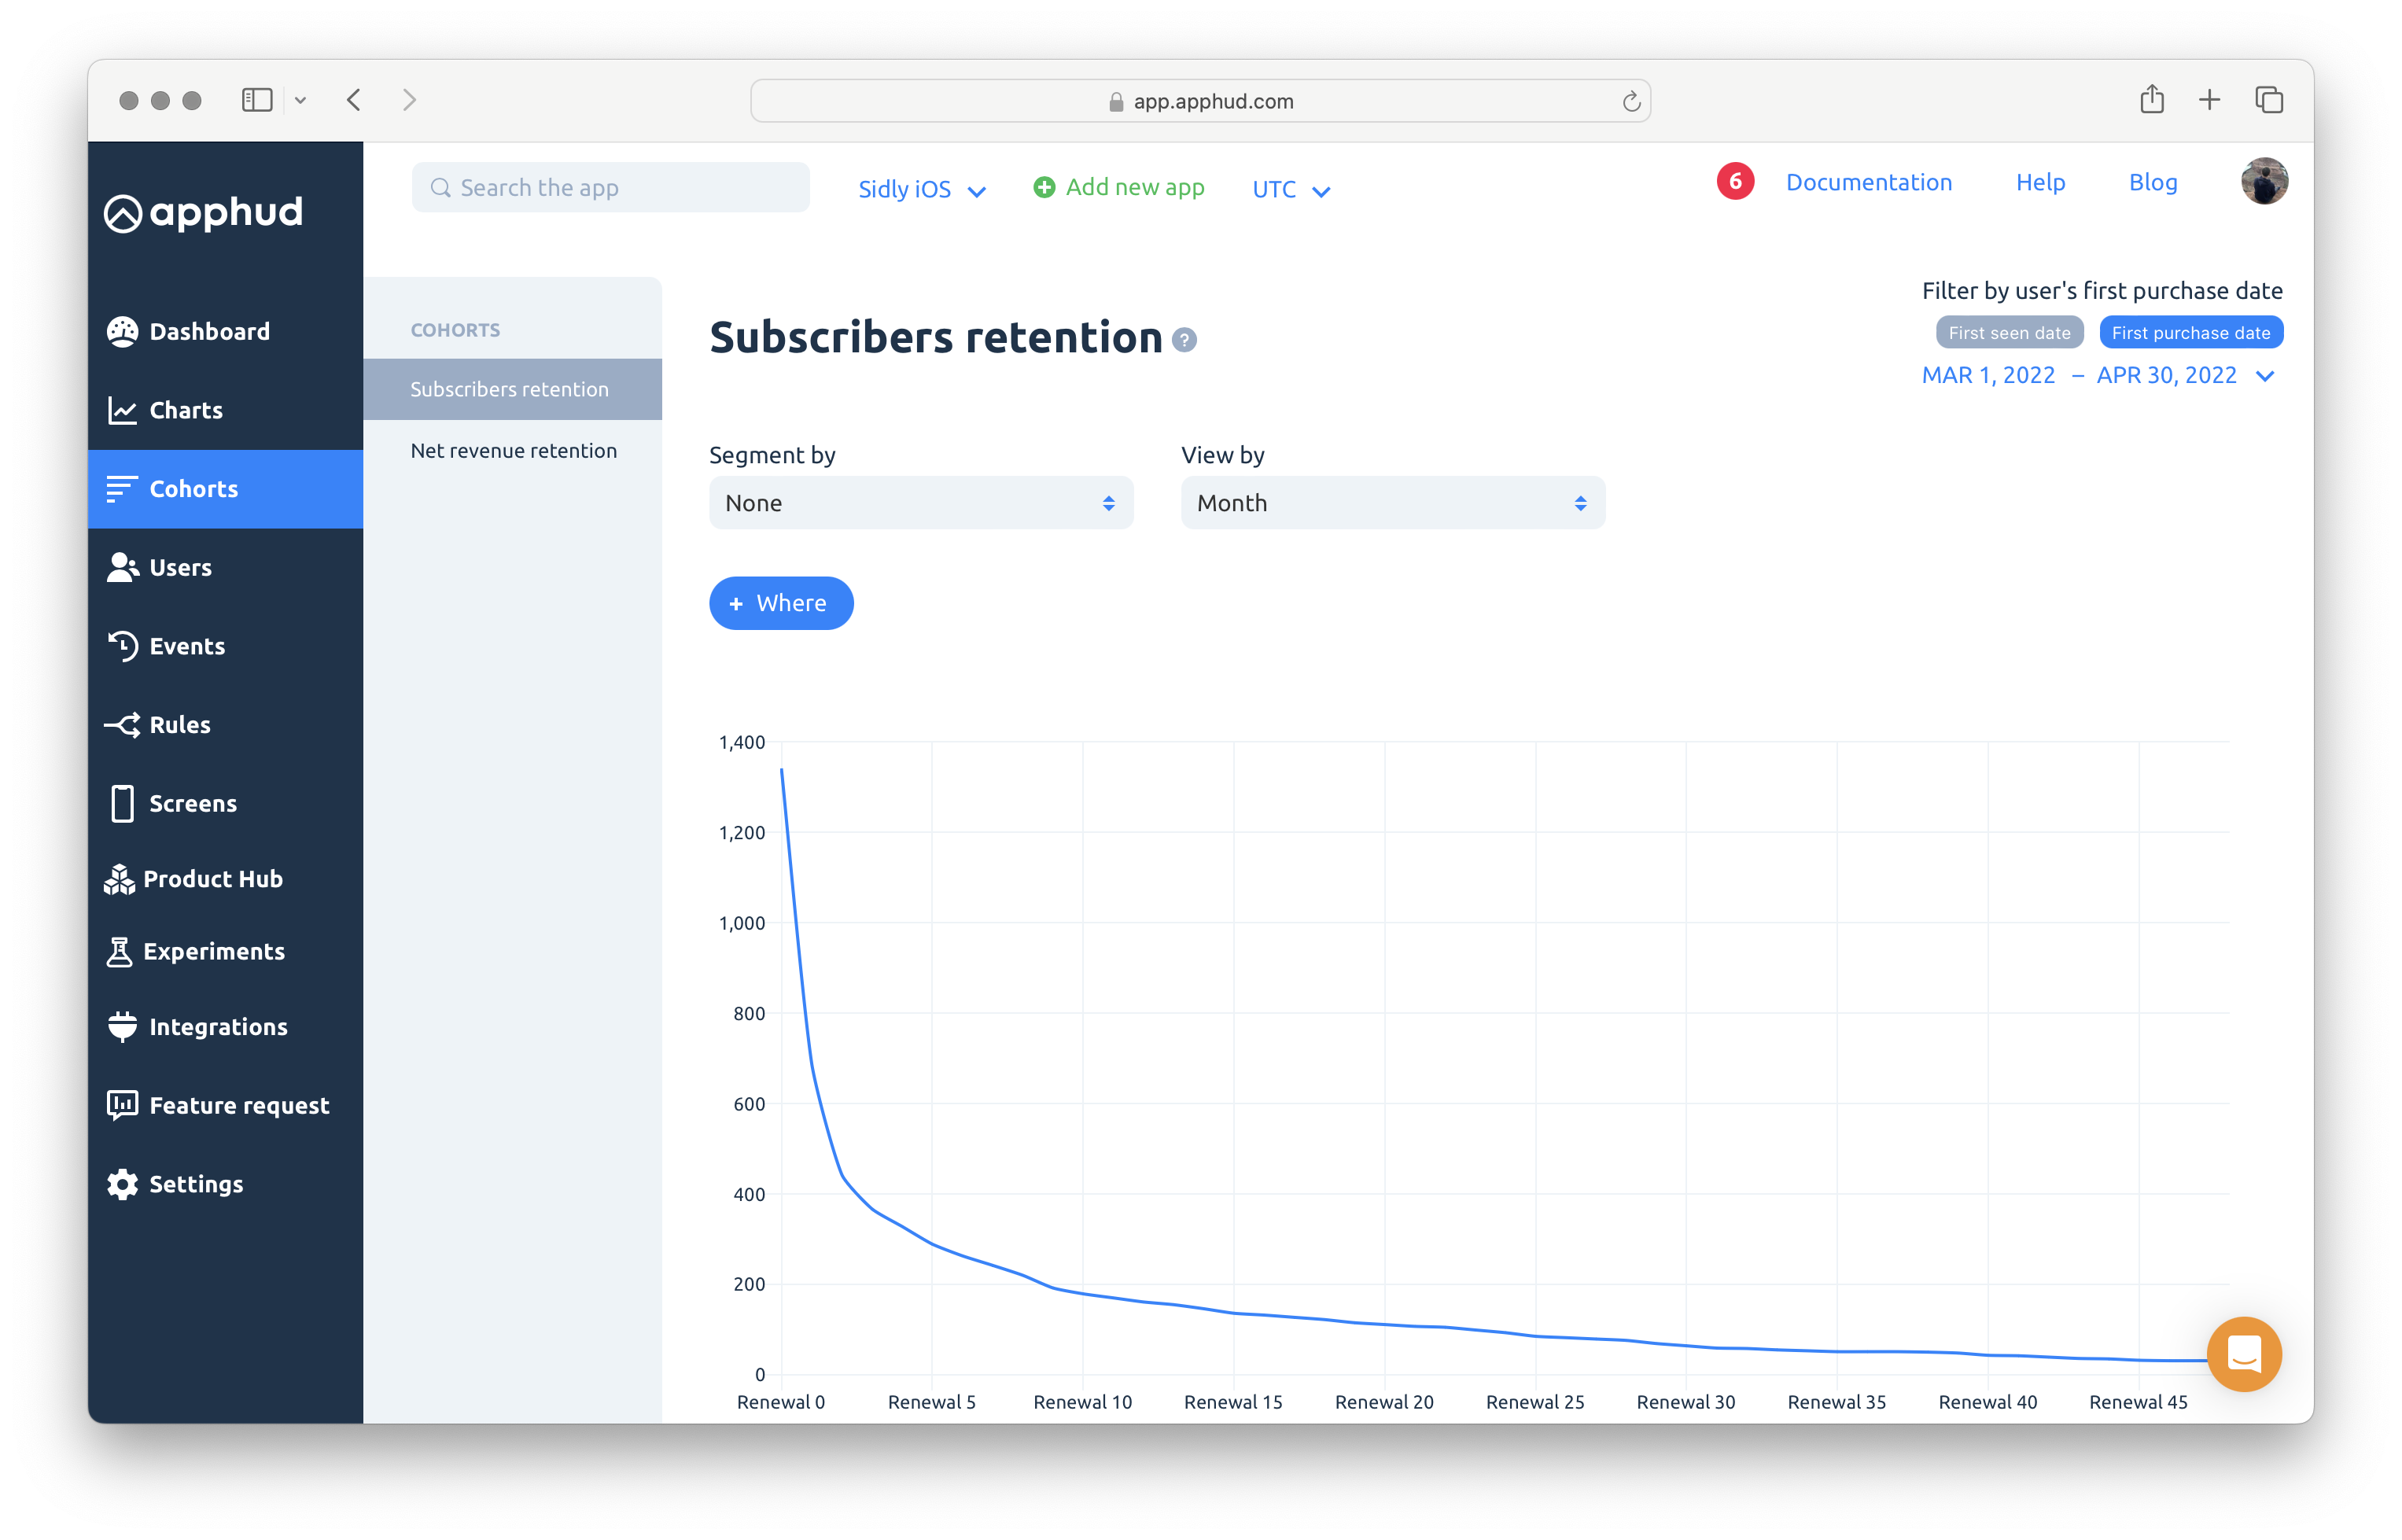
By default, cohorts are calculated based on the user's first seen date. However, you can choose to analyze cohorts based on the first purchase date instead.
Typically, cohorts are built using the user's first seen date. This approach considers the time users may take to decide whether to make a payment, as well as any trial periods that might delay their conversion to paying subscribers.
Analyzing cohorts from the first purchase date can complicate the understanding of user behavior, particularly in determining the impact of marketing efforts.
For instance, users attracted by a campaign in March might only make their purchases in April after a trial period.
Note
Cohorts can be viewed on a weekly, monthly, quarterly, or yearly basis.
Renewal periods
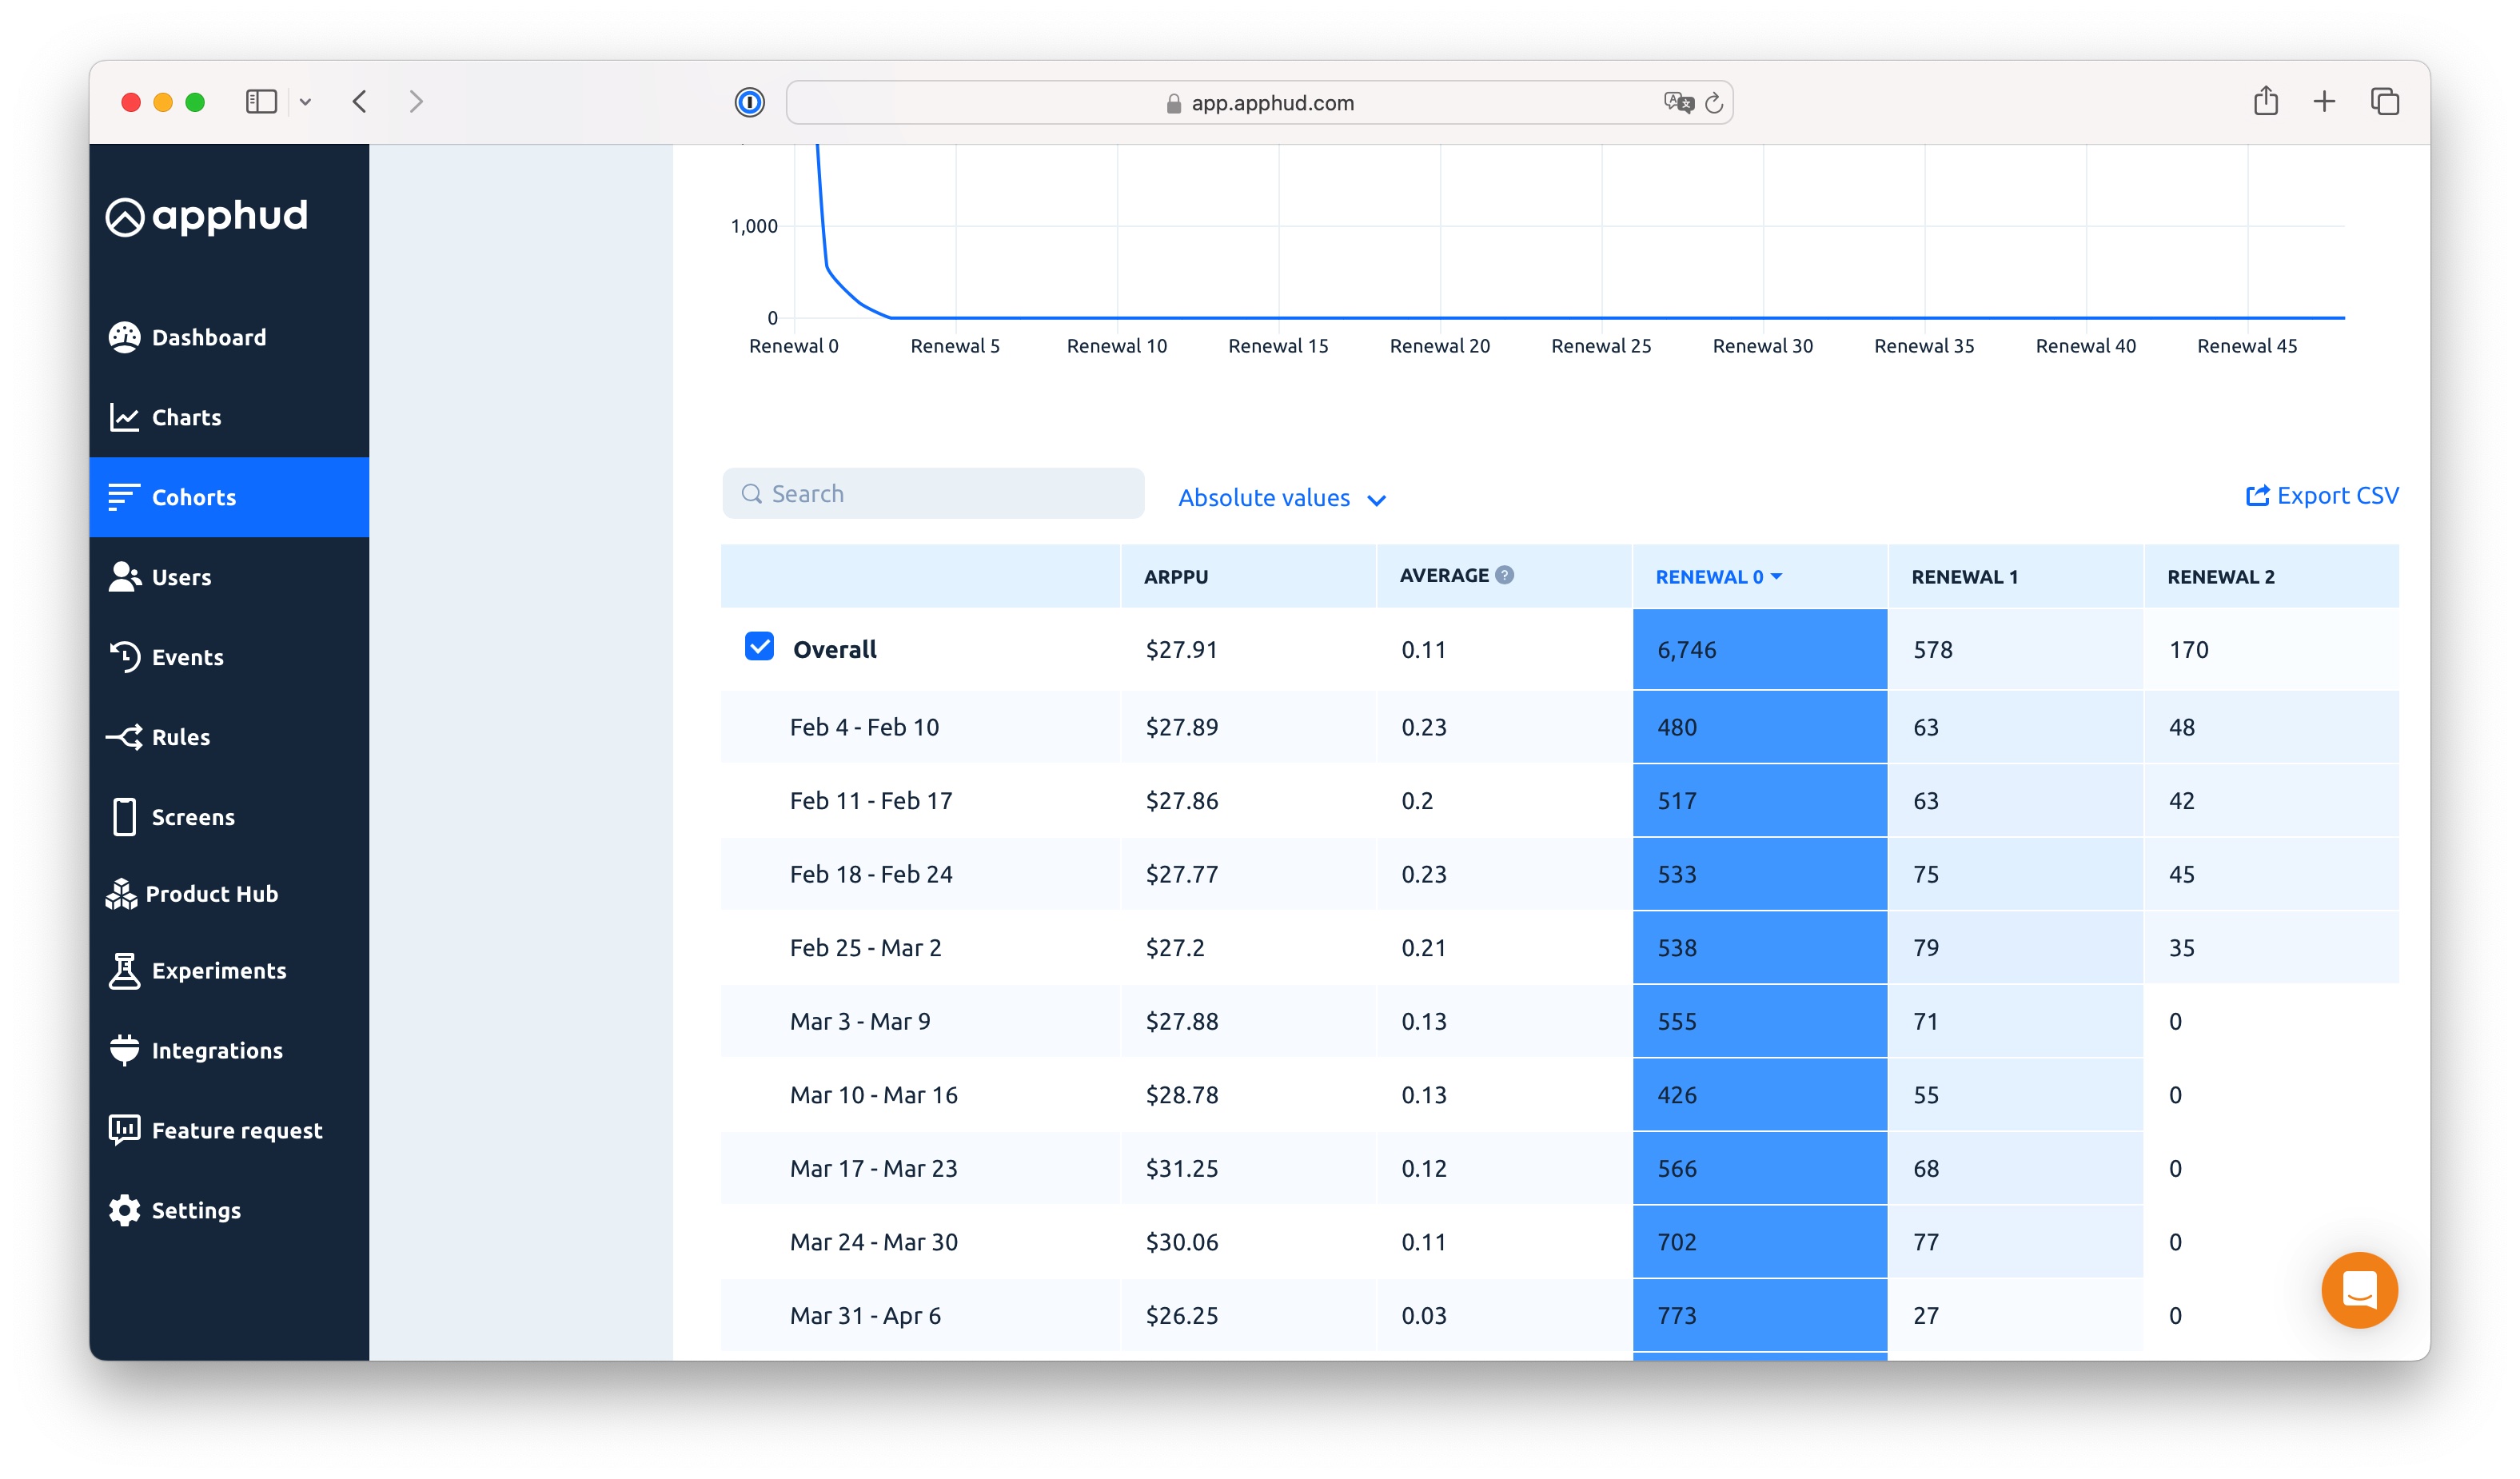
The charts feature columns labeled Renewals 0-N. Each column represents the Nth renewal of a user's subscription. These renewals can occur at irregular intervals. During the grace billing period, the subscriber's status remains active.
Renewal 0 represents the initial subscription purchase when the user makes their first payment, not the start of a trial period.
Subscriptions Reactivation
When a paid subscription fully expires, it marks the end of consecutive user renewals. A subscription is considered fully expired if the paid period has ended and auto-renewal setting is off.
If a subscription expires due to a billing issue but auto-renewal remains active, we do not consider the subscription as fully expired. Note that auto-renewal setting can not be indefinitely active. Apple and Google have policies for automatically canceling subscriptions with unresolved billing issues. Specifically, Apple cancels auto-renewal after 60 days, whereas the cancellation period for Google Play apps is configurable via the Google Play Console.
If users reactivate their subscription after it has been fully expired, they are counted as new subscribers, and their renewal count resets to zero. Thus, a user may appear in the cohorts charts multiple times if they have previously canceled their paid subscription.
For the most current information on subscription cancellation policies, please refer to the following resources:
Subscribers Retention Chart

Shows how app subscribers retain (in other words, how many of them renewing their subscriptions).
Important Note
Subscribers, who made a full refund of their App Store/Google Play subscriptions are not counted in the Renewal 0 group.
ARPPU
Average Revenue Per Paying User (LTV) for each cohort. Sum of all cohort's subscriptions revenue divided by subscribers count.
Average renewals count
How many times an average user in the cohort renews the subscription
Note
For example, "in May cohort average user is renewing subscription 1,35 times"
Net Revenue Retention Chart

Shows your in-apps revenue retention (i.e. how much money left in each cohort after Nth renewal). It's crucial to be aware of how in-app subscription drops.
Net revenue is the amount of money left after each renewal.
Important Note
Revenue is counted as PROCEEDS – after App Store/Google Play commissions and refunds deduction.
Total
Summarized revenue for each cohort.
Updated 3 days ago