
Analyzing A/B tests
How to read A/B test analytics — cohort vs non-cohort metrics, target metrics, Effect, and P-value significance.
Once an A/B test starts running, it accumulates user data and all related metrics. This page explains how to read those numbers.
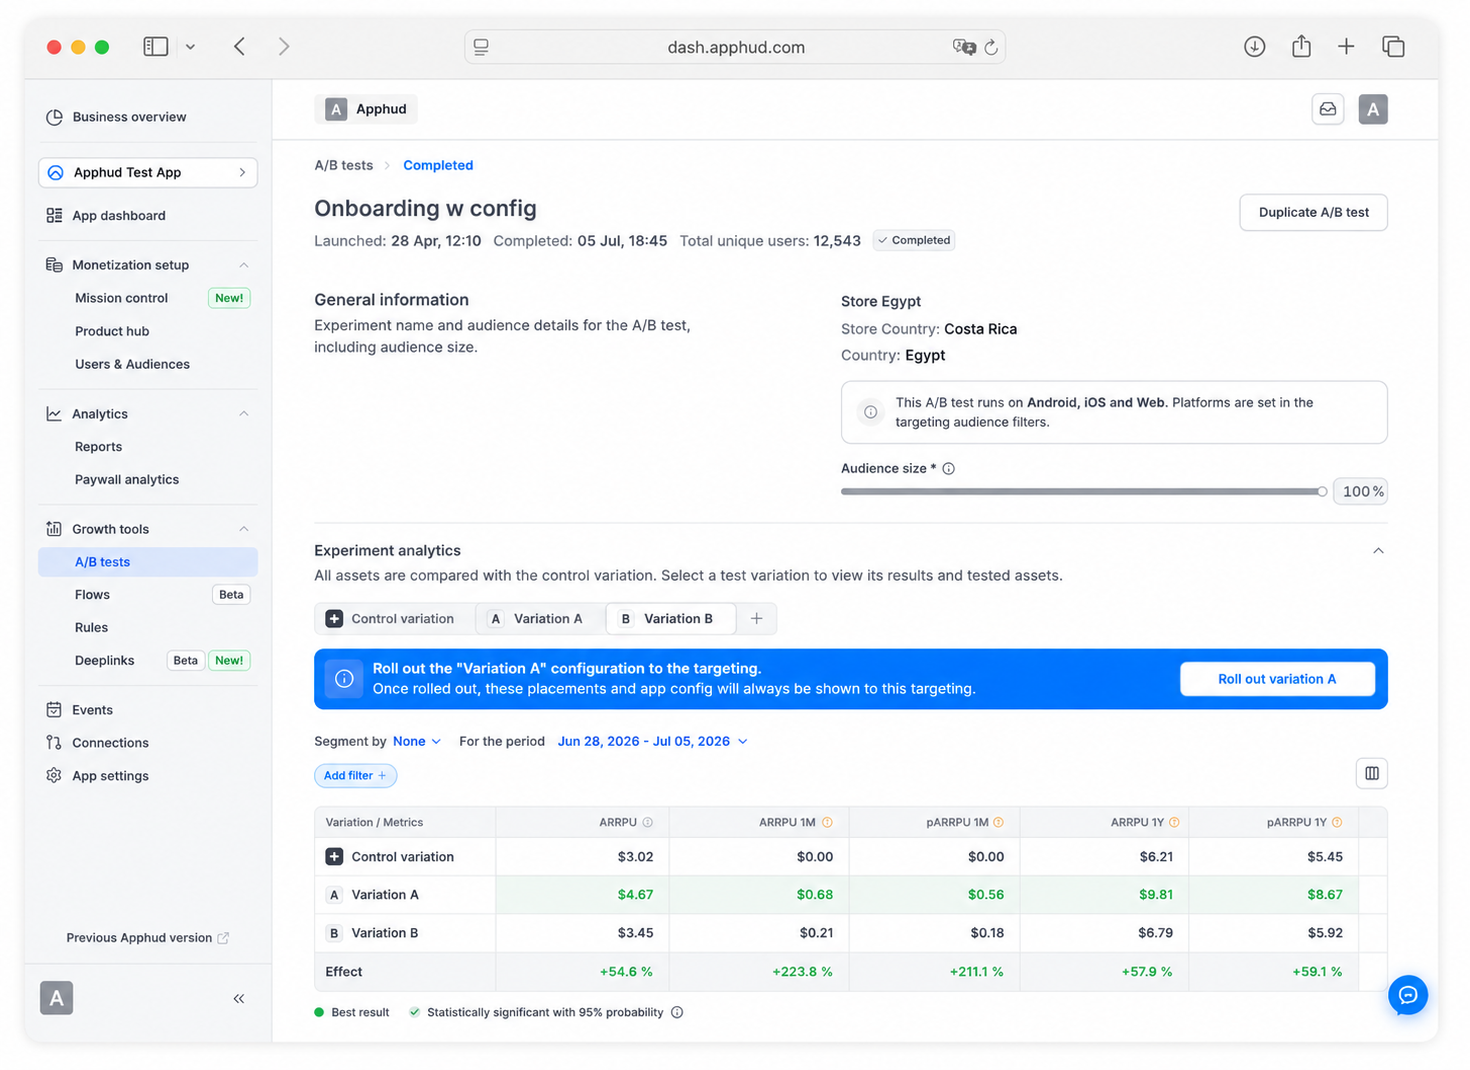
Cohort and non-cohort metrics
The experiment analytics table mixes two kinds of metrics, and the date picker applies to them differently:
- Cohort metrics — the date picker applies to the date users joined the experiment (were distributed to a variation).
- Non-cohort metrics — the date picker applies to the date of the metric's underlying event.
Don't compare cohort metrics with non-cohort metrics directlyIt's an analytics error. For example, View to Trial (cohort) won't match Trials ÷ Unique Views (both non-cohort), because View to Trial allows trial-start events to land after the selected dates.
Cohort metrics
- ARPPU
- ARPU
- ARPAS
- ARPPU 1M / ARPU 1M / ARPAS 1M (Only admin)
- View to Action
- View to Trial
- View to Purchase
- Trial Conversion
- Cohort Proceeds
- Predicted metrics (pARPU, pARPPU, pARPAS, pProceeds — 1M / 3M / 6M / 1Y variants) (Only admin)
Non-cohort metrics
Target metrics
When deciding which variation is better, pick the one metric your test is trying to move and treat it as the target. Common choices:
- View to Purchase — best if the goal is paid conversion.
- View to Trial — best if the goal is trial activation.
- View to Action — best if you treat trial start + paid as equally valuable.
- ARPU — best for overall revenue per assigned user.
- ARPPU — best for revenue per paying user.
- ARPAS — best for revenue per active subscriber including trials.
You can pick any metric — these are just the ones most teams optimize for.
Effect
The Effect column shows the relative change of a metric in a variation compared to Control, as a percentage. Positive = the variation is doing better; negative = worse.
Example. Control conversion = 5%, Variation A conversion = 10% → Effect = +100%. Variation A is twice as good as Control.
P-value
The P-value column shows the statistical significance of the Effect — the probability that the observed difference is due to chance rather than a real effect.
- P-value ranges from 0 to 1.
- Apphud's significance threshold is 0.05 (5%).
- A result is Significant when
P-value ≤ 0.05— you can reasonably reject the null hypothesis (the assumption that the variation is the same as Control). - Otherwise the result is Non-significant.
Apphud notifies you when a result becomes significant on your test.
Don't act on borderline P-valuesA result is significant only when
P-value ≤ 0.05. If your P-value is just above the threshold, it's not significant — even if the Effect looks promising. Either let the test run longer or accept that the result is inconclusive.
Experiment Predictions
Predicted metrics let you compare variations on projected long-term revenue before the test has actually run for that long. They're available if LTV Predictions are enabled for your app. See Experiment Predictions for the calculation methodology and per-metric definitions.
Updated 3 months ago