
Refund Requests Report
App Store and Google Play refund requests by volume, value, decision rates, and processing times.
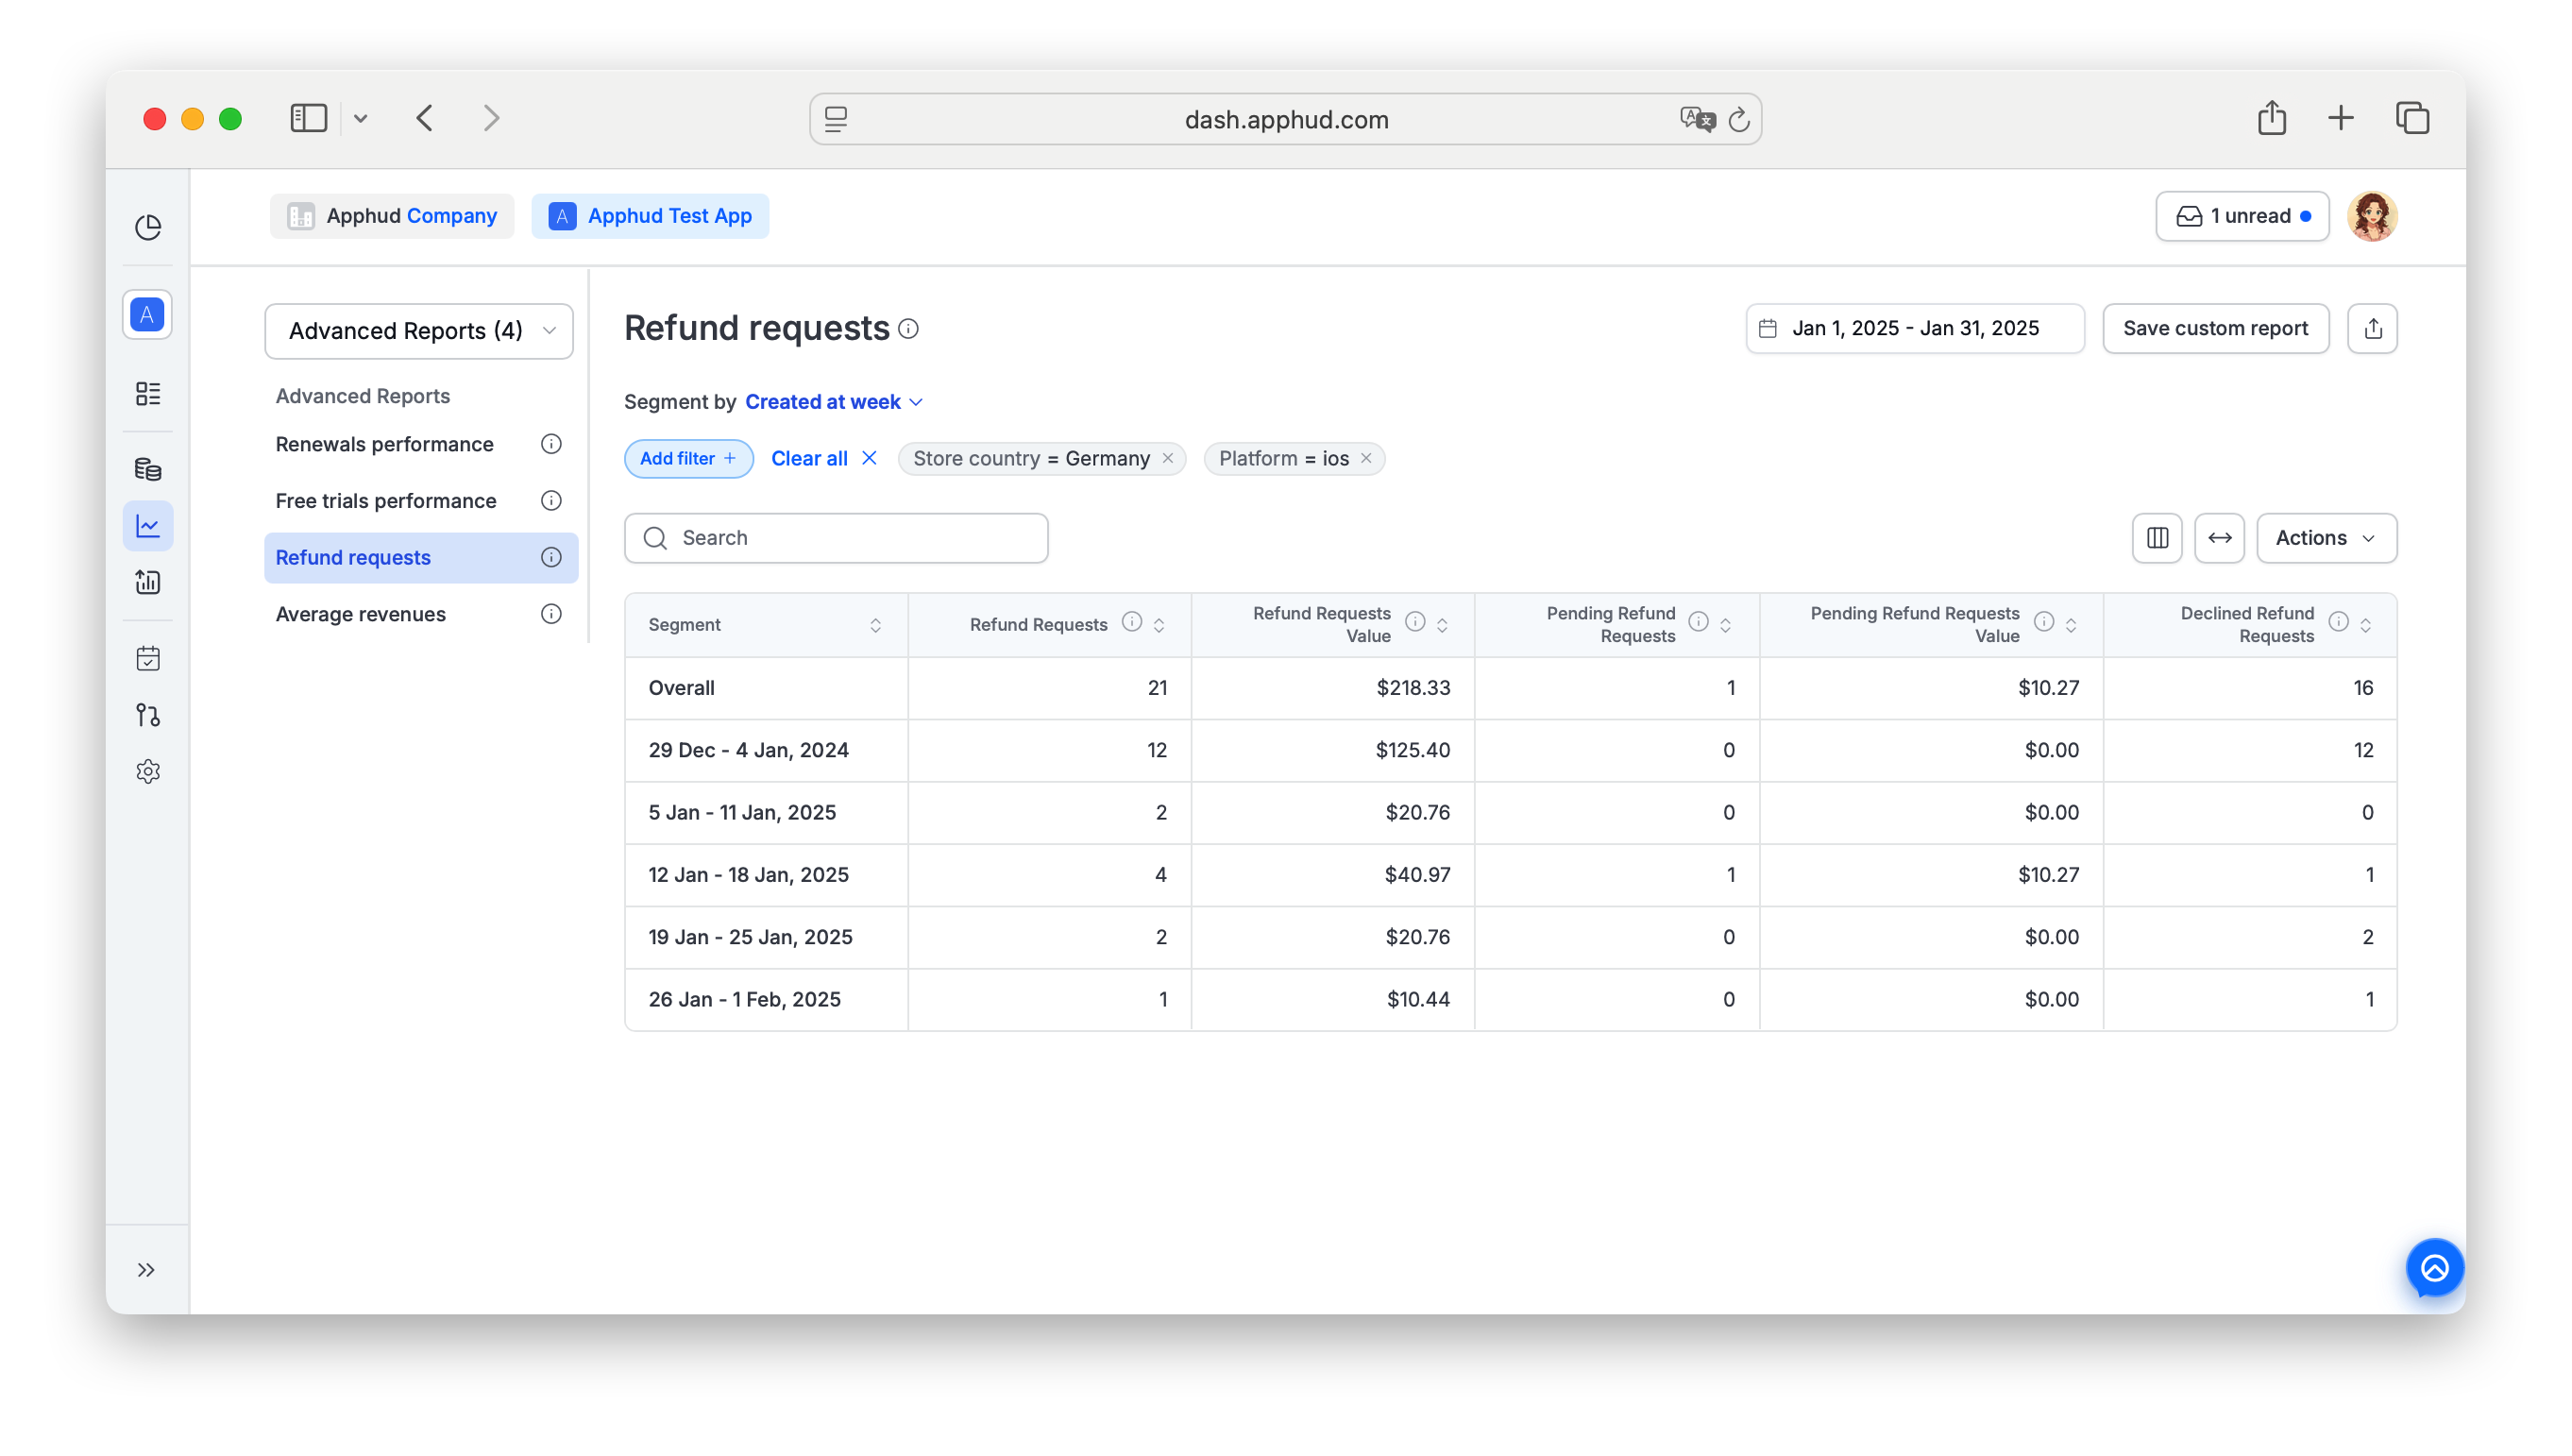
Refund Requests Report provides a comprehensive overview of refund requests and their outcomes, processed via Apple Server Notifications V2 (iOS) and Google Real-Time Developer Notifications (Android). Includes volume and dollar amount of requests (approved, declined, pending), approval / decline rates, and average / median processing times.
Find Refund Requests Report under Analytics → Reports → Advanced Reports in the sidebar.
Access NoteThis report is available to Pro plan and above with the Win Back Refunds add-on enabled. Contact Apphud Support for pricing and to activate the add-on.
Data availability
Data for this report is available starting from November 1, 2024.
Segments like "Created on day / week / month / quarter / year" apply to refund event dates, not the original purchase dates.
Platform support
iOS and Android — relies on Apple Server Notifications V2 (iOS) and Google Real-Time Developer Notifications (Android) for the source events refund_requested and refund_declined.
Metrics
Metric order here vs. in the reportThe metrics below are grouped by type (Volume, Outcomes, Behavior).
This is not the report's left-to-right column order.In the report, columns go: Refund Requests → Refund Requests Value → Pending Refund Requests → Pending Refund Requests Value → Declined Refund Requests → Declined Refund Requests Value → Decline Rate → Approved Refund Requests → Approved Refund Requests Value → Approval Rate → Average Approved Refund Requests per Subscription → Median Days to Refund Request → Average Hours to Refund Decision.
Note that the report lists Declined before Approved, whereas the Outcomes group below lists Approved first.
Volume
- Refund Requests — total user-submitted refund requests in the period.
- Refund Requests Value — total dollar amount of those requests.
- Pending Refund Requests — count awaiting the store's decision.
- Pending Refund Requests Value — dollar amount of pending.
Outcomes
- Approved Refund Requests — count the store approved (excluding refunds tied to upgrades / crossgrades).
- Approved Refund Requests Value — dollar amount approved.
- Approval Rate (%) — Approved / (Approved + Declined).
- Declined Refund Requests — count the store declined.
- Declined Refund Requests Value — dollar amount declined.
- Decline Rate (%) — Declined / (Approved + Declined).
Behavior
- Average Approved Refund Requests per Subscription — average refund events per refunded subscription. The store processes each transaction's refund individually — a weekly subscriber requesting refunds for the last month files 4 separate requests.
- Median Days to Refund Request — median days from latest purchase receipt to its refund request (excludes batched requests for older transactions).
- Average Hours to Refund Decision — average hours from submission to the store's decision.
Pending requests affect ratesApproval Rate and Decline Rate fluctuate as the store resolves pending requests. Requests stay in "Pending" until the store issues a final decision.
Supported filters and segments
Refund Requests Report supports all standard segments and filters documented in Reports → Filters and segments. The most useful segments are Product and Store Country. You can nest two segments and apply multiple filters.
"Created at" segment applies to refund events"Created on..." applies to the refund event date, not user creation date.
By Reason (Win Back Refunds only)
One chart-specific segment available when the Win Back Refund Requests feature is on:
- By Reason — splits requests into "Managed by Apphud" vs "None" (user-initiated).
Filter-only (not available as Segment by):
- Permission group — segment support is planned, currently filter only.
- Screen
- Experiment variations
Learn moreWhat Win Back Refunds are and how to use this report: Refund management use cases.
FAQ
Why do approval and decline rates fluctuate?
The store resolves pending requests over time. Until a request gets a decision, it counts as "Pending" and doesn't enter the approval/decline numerator. As pending drains, rates settle.
Does this report include Android?
Yes. It covers both App Store refund requests (iOS) and Google Play chargeback reviews (Android) — the underlying events (refund_requested, refund_declined) are emitted the same way for each.
What's the difference between this report and the Refunds chart?
- Refunds chart shows the gross amount refunded (approved, processed refunds) on the date the refund actually happened.
- Refund Requests Report shows request lifecycle — how many users asked, how many got approved vs declined, and timing.
Use Refunds for cash impact. Use this for understanding refund-request behavior and the store's decisioning pipeline.
Can I segment by Refund Reason here?
Only when the Win Back Refund Requests feature is on. For broader refund-reason analysis, see Refunds and Refund rate, which both support the standard Refund Reason segment.
Updated 27 days ago