
Conversions Charts
Definition
Conversion Charts is a group of funnel-type cohort charts that show the progression of conversion events.
The majority of the Conversion charts are based on users' app installation dates (First seen date).
For example, if there is a row with the date of January 28, it summarizes trial conversions for users who originally installed the app on January 28 and then converted to regular subscribers any day after the install and trial start (not only on January 28).
Unique by UsersAll conversion events are unique by users.
If your app allows two simultaneous subscriptions (say, with a trial period), it will be counted as a single user who started a trial (not two trials).
The same applies to trial conversion events. If a user converts two trials to regular subscriptions within the app, it will be shown as a single user who converted from trials to a paid subscriber.
Actions of users, who made a full refund of their App Store/Google Play subscriptions are still counted in the reports metrics.
Conversion Charts include the following:
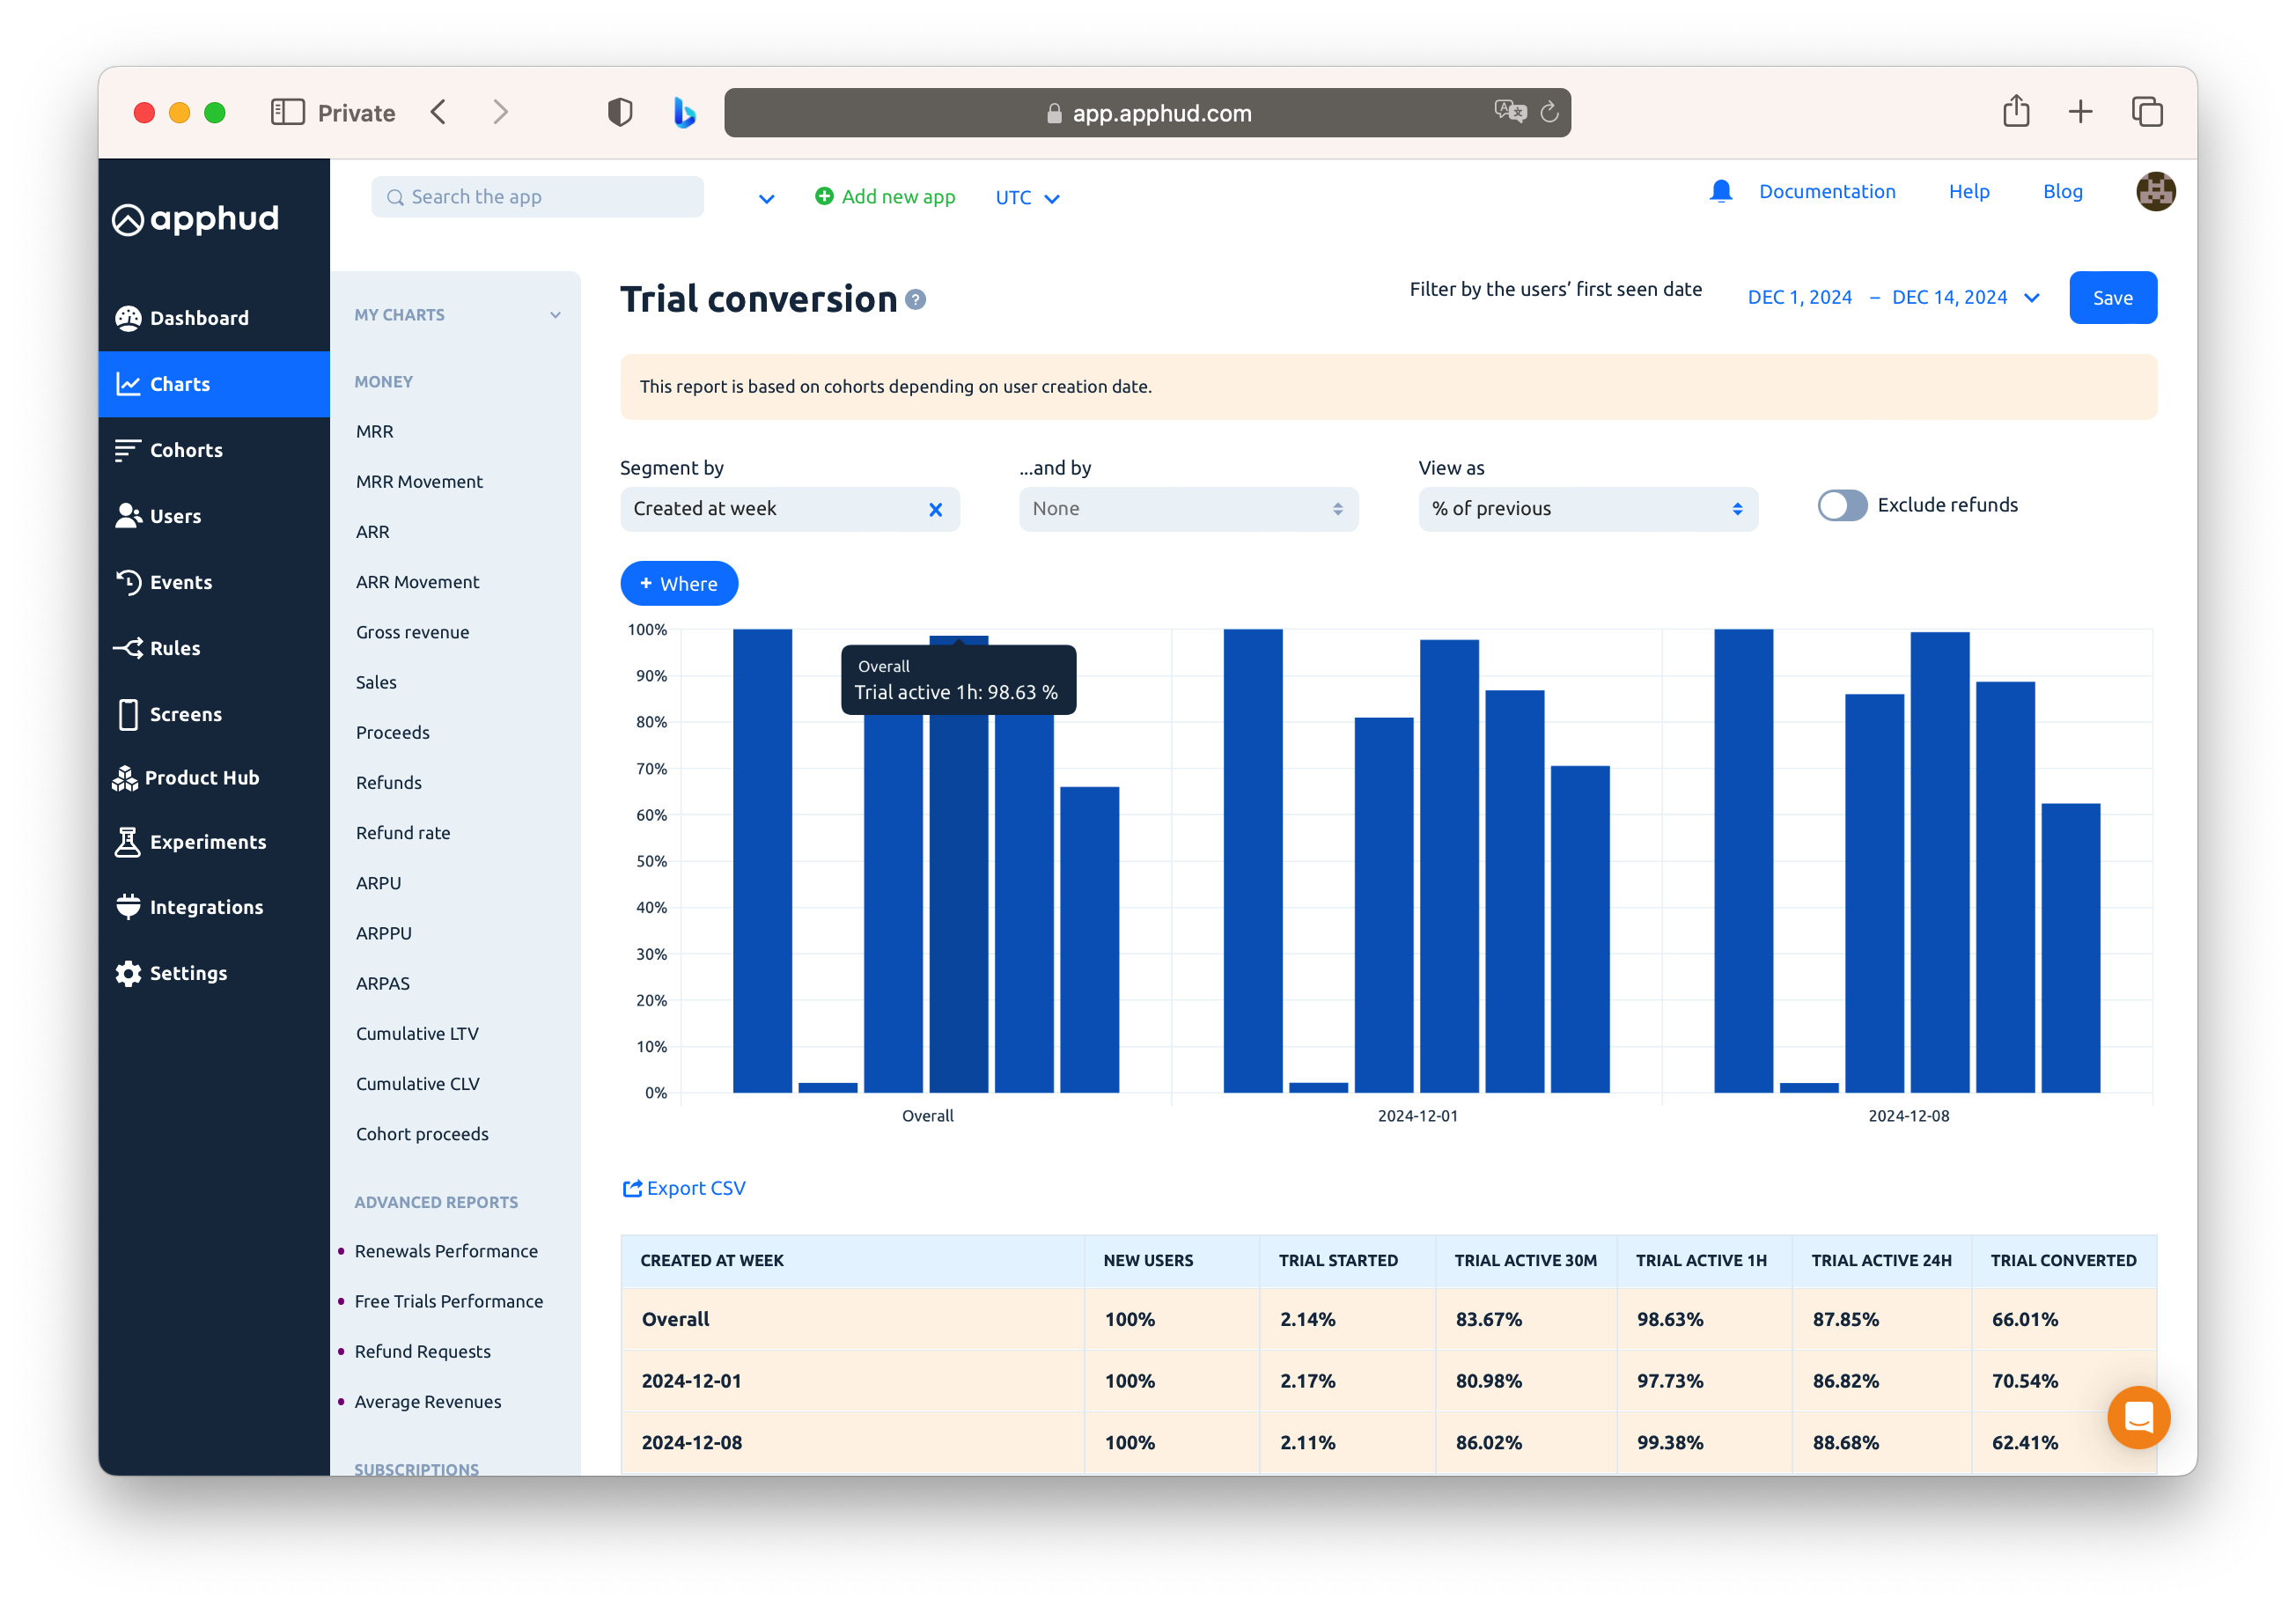
- Trial Conversion Chart: Measures a conversion funnel from App Install to Free Trial and to Free Trial Conversion. In addition to these regular conversion metrics, the chart has the following ones:
Trial Active 30m – The number of trials that remained active 30 minutes after starting;
Trial Active 1h – The number of trials that remained active 1 hour after starting;
Trial Active 24h – The number of trials that remained active 24 hours after starting. - Regular Subscription Conversion Chart: Measures a conversion funnel from App Install to Paid Subscription start.
- Paid Introductory Offer Conversion Chart: Measures a conversion funnel from App Install to Paid Introductory Offer start.
- Promo Offer Conversion Chart: Measures a conversion funnel from App Install to Promo Started event and to Promo Converted event.
- Non-Renewing Purchase Conversion Chart: Measures a conversion funnel from App Install to Non-Renewing Purchase.
- Flows Conversion Chart: Measures a conversion funnel from a Flow visit to a Paywall view and to any web purchase Action, whether it's trial start, subscription, or non-renewing purchase.
View as Parameter
You can view data calculated by three options:
- View as Percent of Total: Measures the funnel where the value is the percentage of the first column's value, particularly from the app installs count.
- View as Percent of Previous: Measures the funnel where the value is the percentage of the previous column's value. For the Trial Conversion chart, the Trial Converted percentage will be based on the "Trial Active 24h" rather than "Trial Started".
- View as User Count: In most conversion charts, this option allows you to view each funnel step as a count of unique users who installed the app or performed the corresponding action.
In the Flows Conversion chart, this is replaced with Count, which reflects the number of times the flow was initiated. This approach ensures consistency when tracking web-based flows, where identifying individual users may not always be reliable.
Exclude Refunds Parameter
In most conversion charts, this parameter allows you to exclude from analysis those purchases that were later refunded.
The parameter is not available on the Flows Conversion chart.