
Refunds
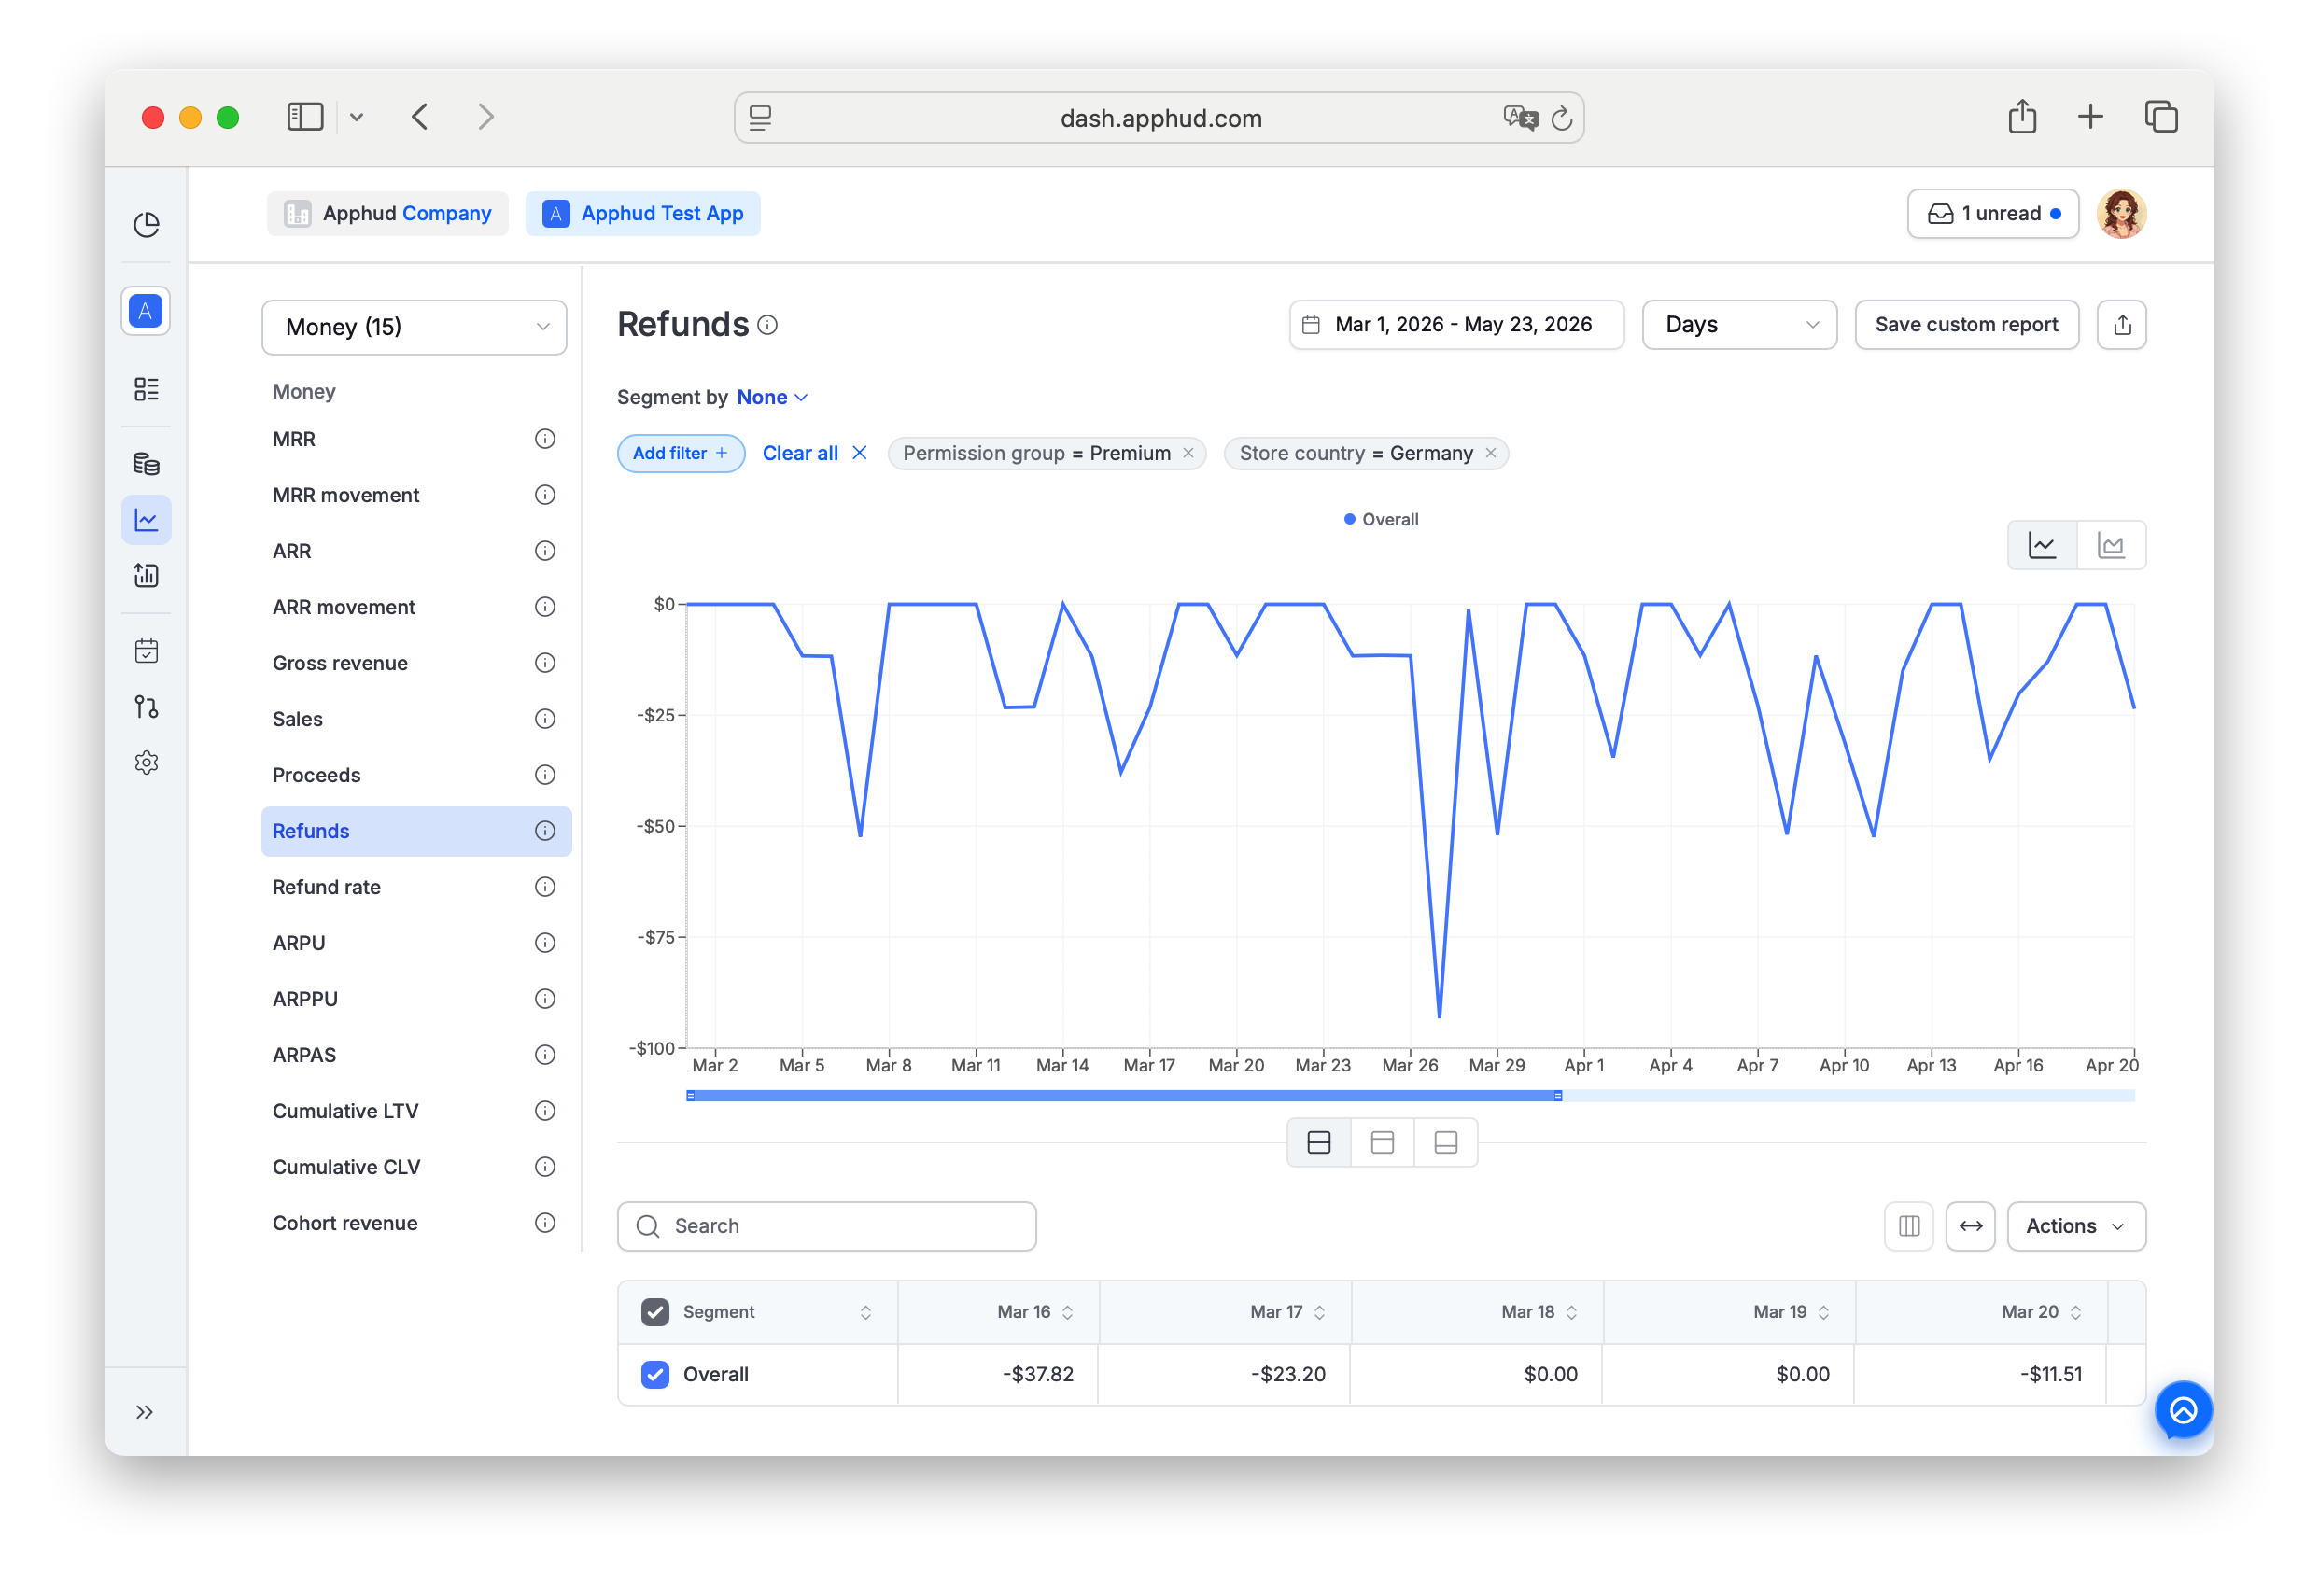
Total amount refunded to customers during the selected period.
Refunds is a non-cohort chart that indicates the total amount refunded to customers during the selected period. It includes:
- Refunds processed through customer support (App Store, Google Play, web payment provider, etc.)
- Prorated refunds during subscription upgrades (when a user is partially refunded for the unused portion of their previous plan)
Find Refunds under Analytics → Reports → Money in the sidebar.
What's counted
Refunds plots the gross amount refunded — i.e., the original billed amount that's being returned to the customer. This is before store commission and VAT.
For the net impact on developer revenue (the amount you actually lose after the store's commission and VAT are accounted for), see the Refunds Revenue Type slice on the Proceeds chart.
For the rate of refunds (percentage of transactions refunded), see Refund rate.
Supported filters and segments
Refunds supports all standard segments and filters documented in Reports → Filters and segments.
Filter-only (not available as Segment by):
- Permission group — segment support is planned, currently filter only.
- Screen
- Experiment variations
NoteThe Install Time segment (First seen week / First seen month) is especially useful here — break the chart into install-cohort lines or stacks to see how each acquisition cohort's revenue evolves. See Reports → Install Time.
FAQ
Why are refund amounts showing up in old periods now?
Refunds are recorded on the date the refund was processed, not when the original purchase happened. If store server notifications arrive late, refunds for older transactions can land in this chart days or weeks after the actual refund decision. See About Analytics → Why can historical data in my charts change over time?.
What's a prorated refund and why is it on this chart?
When a user upgrades from a cheaper plan to a more expensive one mid-period, the store issues a partial refund for the unused portion of the old plan and bills the new plan. The prorated portion appears here. It's a normal part of subscription upgrades — not a customer complaint.
Why doesn't this match the Refunds slice on Proceeds?
The Refunds chart shows gross refund amounts (what was billed to the customer). The Refunds slice on Proceeds shows the net revenue you would have kept had the refund not occurred — i.e., already-net-of-commission-and-VAT. Both are correct; they answer different questions. Use this chart for "how much did customers get back"; use Proceeds → Refunds for "how much did I lose".
Why is this chart non-cohort?
Refunds is plotted on the date the refund was processed, not the date of the original purchase or the user's first-seen date. A refund of a year-old transaction shows up today, not last year.
How do I tell user-requested refunds from prorated upgrade refunds?
Currently they're aggregated. For deeper analysis of user-requested refunds specifically, see Refund Requests Report.
Updated about 1 month ago