
Business Overview
Create custom dashboards to monitor key business metrics across multiple apps.
Business Overview is Apphud's company-level analytics surface. It lets you build custom dashboards that aggregate widgets with metrics across all your apps and platforms in one view, combining real-time state (Now metrics) and historical trends (Overview metrics).
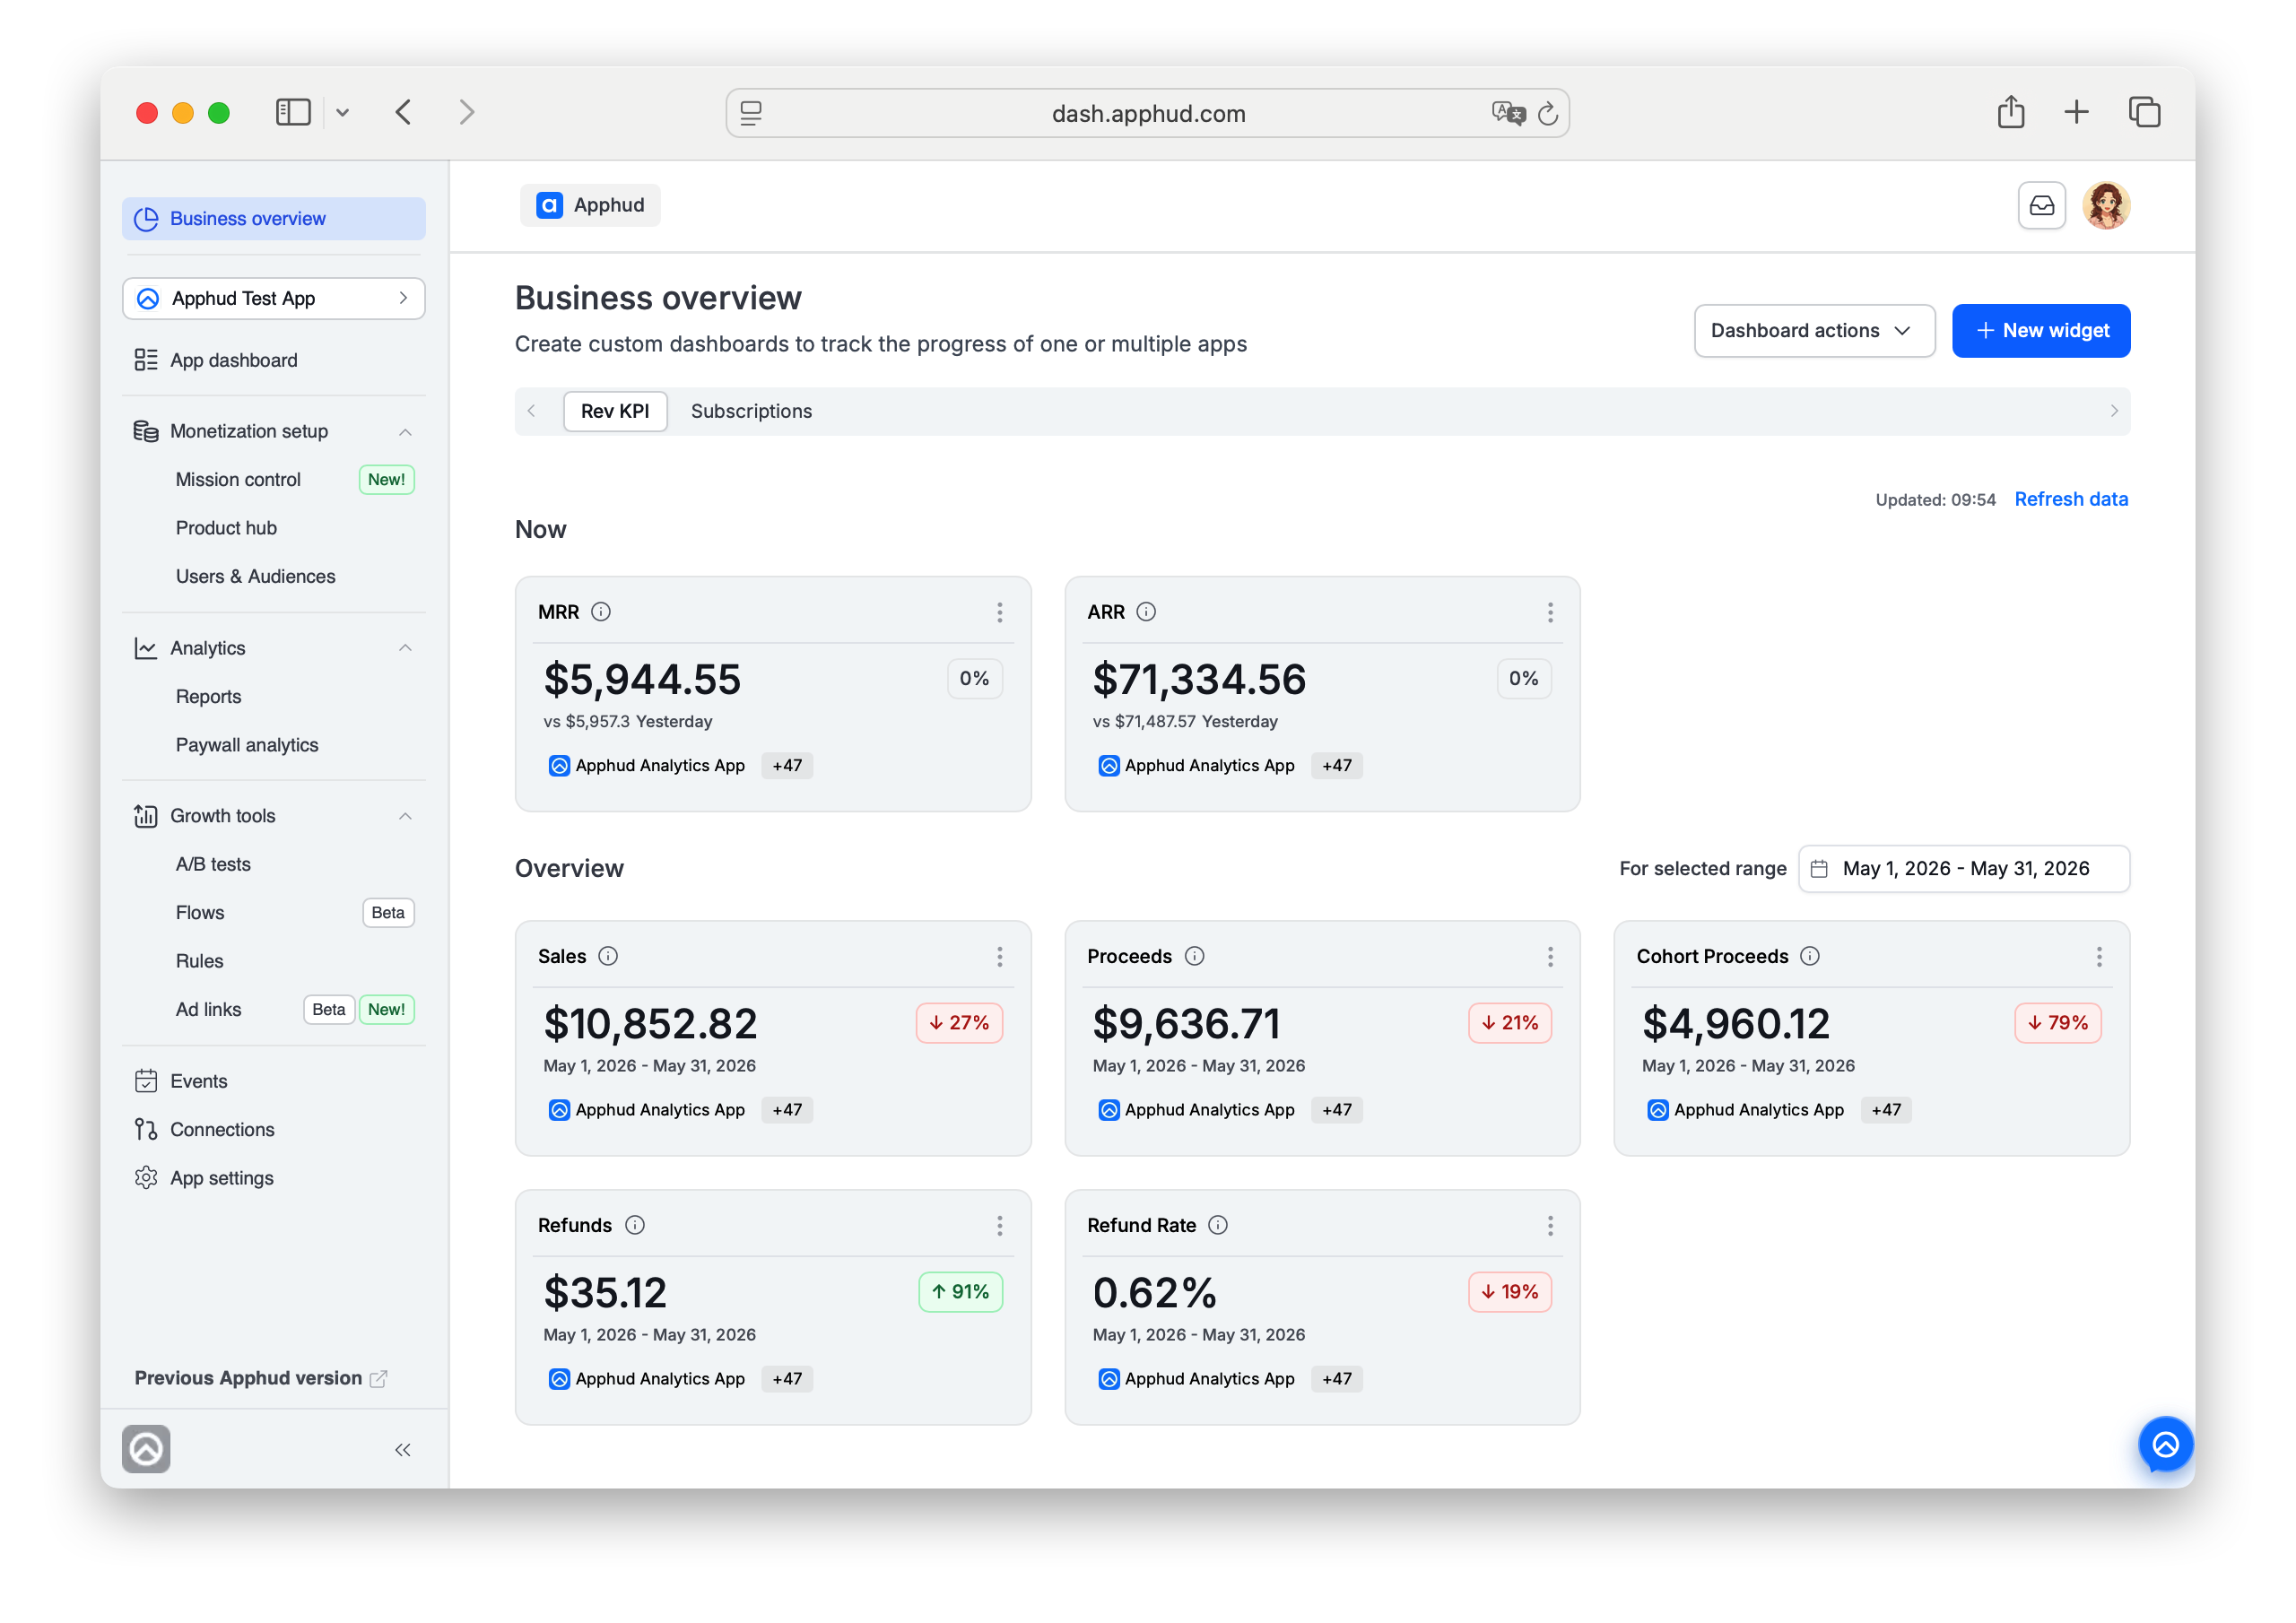
Capabilities at a glance
- Aggregate subscription, revenue, conversion, refund, and cohort metrics across multiple apps and platforms (iOS, Android, Web) in one place
- Combine real-time (Now) and historical (Overview) metrics on the same dashboard, with per-widget or global time ranges and period comparisons
- Create unlimited custom dashboards per company, each with its own time zone and Apps & Platforms scope inherited by widgets; start from one of 6 prebuilt templates or build from scratch
- Apply filters per widget — use the dashboard's default scope, or add your own (platform, country, product, attribution, user properties, etc.)
- Display Overview widgets as a number, line chart, or bar chart; reorder widgets via drag-and-drop
- Access programmatically via API (stable dashboard/widget IDs) or on the go in the Apphud iOS app
When to use Business Overview
Use Business Overview when you need a flexible, company-level view of your business metrics instead of a single-app fixed dashboard analytics report.
Business Overview is especially useful when you need to:
- view your entire app portfolio in one place — track total MRR, proceeds, and subscriptions across all apps
- build separate dashboards for different teams, workflows, or business questions
- monitor the same metric across different apps without switching between app-level reports
- compare performance by platform, country, product, campaign, attribution source, or users segment
Access
At the moment, Business Overview is available to Company Owners and Admins. These users can view and manage company-level dashboards that aggregate data across multiple apps.
Regular Users do not have access to Business Overview.
Key concepts
Dashboard
A dashboard is a custom collection of widgets.
Each dashboard has:
- dashboard name
- time zone (which may be different from the project Time Zone)
- an Apps and Platforms scope (see Dashboard scope below)
- set of widgets (optional template used at creation)
The dashboard time zone affects how date-based periods are calculated inside that dashboard.
For example, Today, Yesterday, Last month, and custom date ranges follow the dashboard time zone.
Widget
A widget is a single metric block on a dashboard.
Each widget has its own configuration:
- widget name
- selected app(s) — prefilled from the dashboard scope, see Dashboard scope below
- metric type: Now or Overview
- metric
- for Overview widgets, a display type: number, line chart, or bar chart
- default time period (for Overview widgets)
- optional filters
When you select multiple apps for a widget, Apphud aggregates the configured metric across all the selected apps and platforms (iOS, Android, and Web) with currency normalization to USD and event time converted to dashboard timezone. Apps without the required data source for a metric simply don't contribute to the aggregated value.
Widgets are independent of each other.
Different widgets on the same dashboard can use different apps (where allowed, see Dashboard scope), metrics, periods, and filters.
A Widget position on the dashboard can be changed via drag-and-drop.
Metric type
Business Overview supports two metric types.
Now metrics show current-state values that may change during the day. Examples include MRR, ARR, active subscriptions, active trials, and subscriptions currently in billing grace period or billing retry, etc.
Overview metrics show historical values calculated for a selected time period. Examples include revenue, proceeds, refunds, trials converted, billing issues, new users, ARPU, conversion rates, etc.
The selected metric type determines which metrics are available for the widget.
Create a dashboard
If no dashboards exist, Business Overview shows an empty state asking you to create a dashboard.
To create a dashboard:
- Open Business Overview.
- Click Dashboard actions.
- Select Create new dashboard.
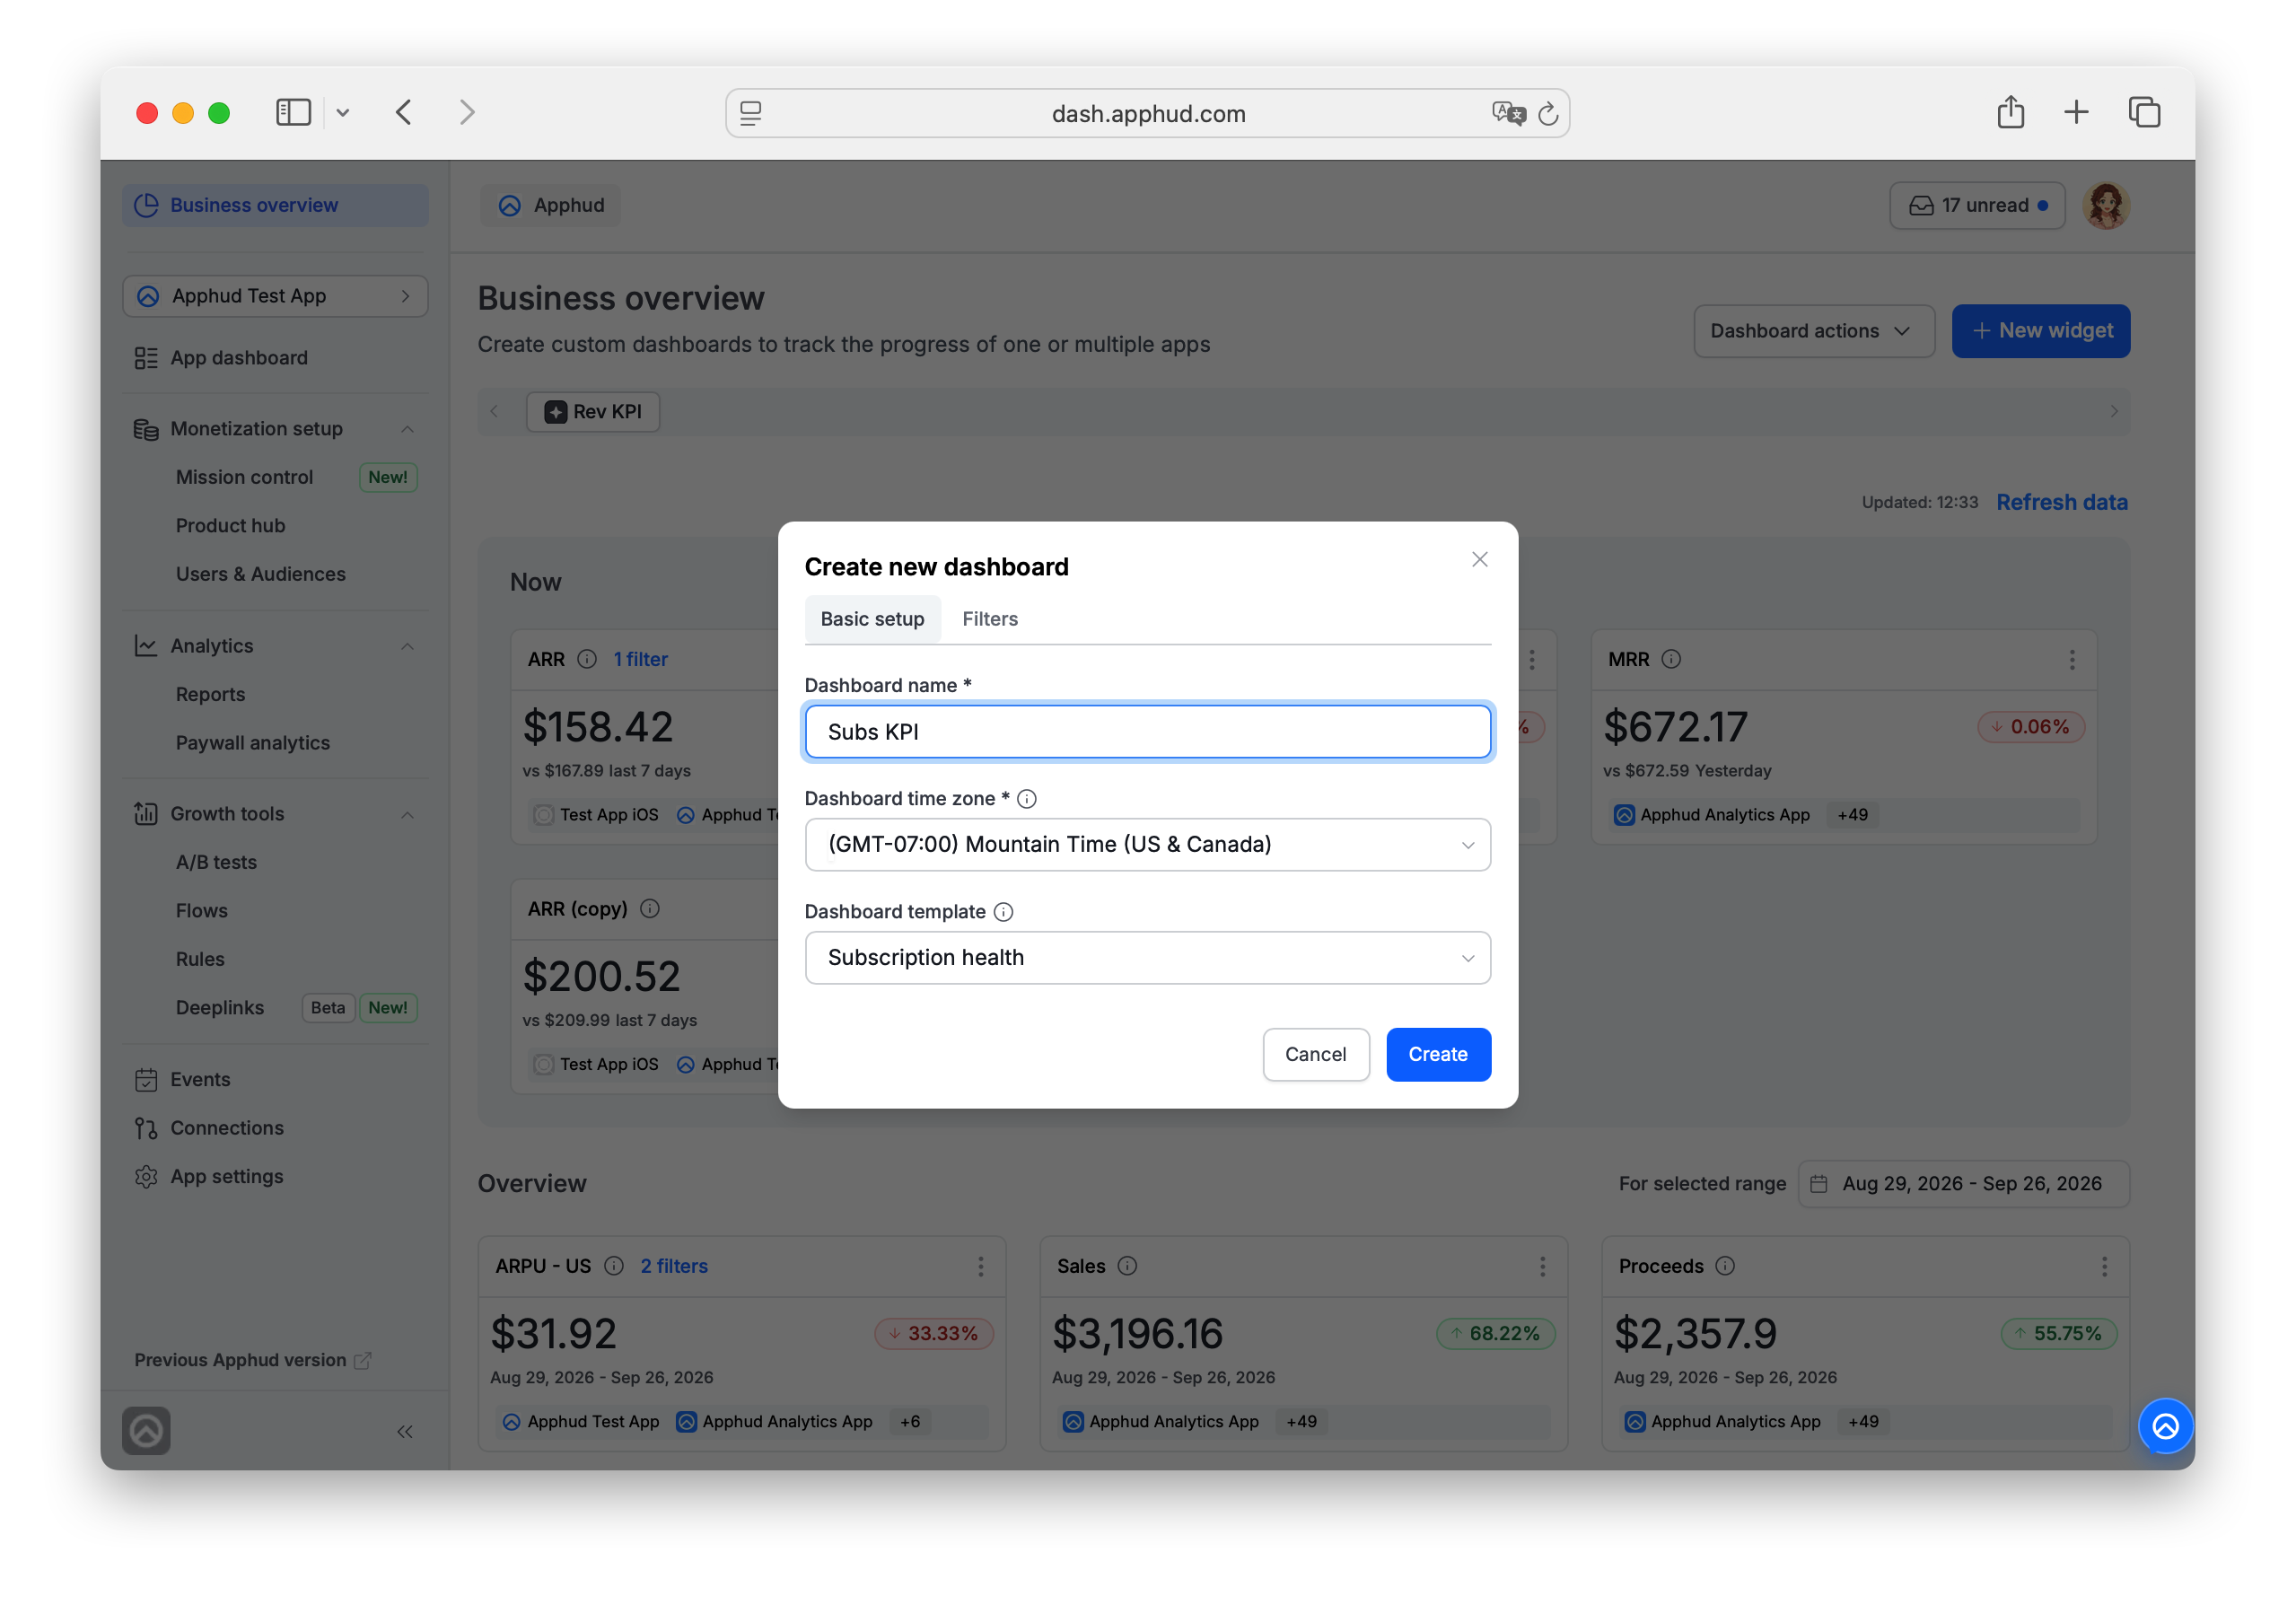
- On Basic setup,
- enter the dashboard name ,
- select the dashboard time zone,
- select a dashboard template, or choose No template.
- On Filters, set the dashboard's Apps and Platforms scope — see Dashboard scope above.
- Create the dashboard.
After the dashboard is created, Apphud asks whether you want to add a widget now. You can add a widget immediately or close the prompt and add widgets later.
Dashboard templates
When creating a dashboard, you can select a template.
Templates create dashboards with predefined widgets for common business scenarios:
- Main metrics — key subscription, revenue, conversion and audience metrics in one dashboard
- Revenue analysis — revenue, proceeds, refunds, MRR, ARR
- Subscription Health — subscription state, trials, intros, promos, billing states, lifecycle events
- User acquisition & conversion — downloads, trial starts, paid conversions, conversion rates, ARPU metrics
- Refund & churn analysis — refunds, refund rate, prevented refunds, billing issues, trial cancellations
- Cohort & growth analysis — cohort proceeds, average revenue metrics, trial conversions, renewals
Template usage is optional.
You can edit a dashboard created from a template: add widgets, remove, reorder or edit widgets.
See Business Overview templates for the full list of widgets included in each template.
Dashboard scope (Apps & Platforms)
Every dashboard has a Filters tab (open it via Dashboard actions → Edit, or while creating a dashboard) that sets the default Apps and Platforms scope for the whole dashboard — as the tab itself notes, "These settings will apply to all widgets on this dashboard."
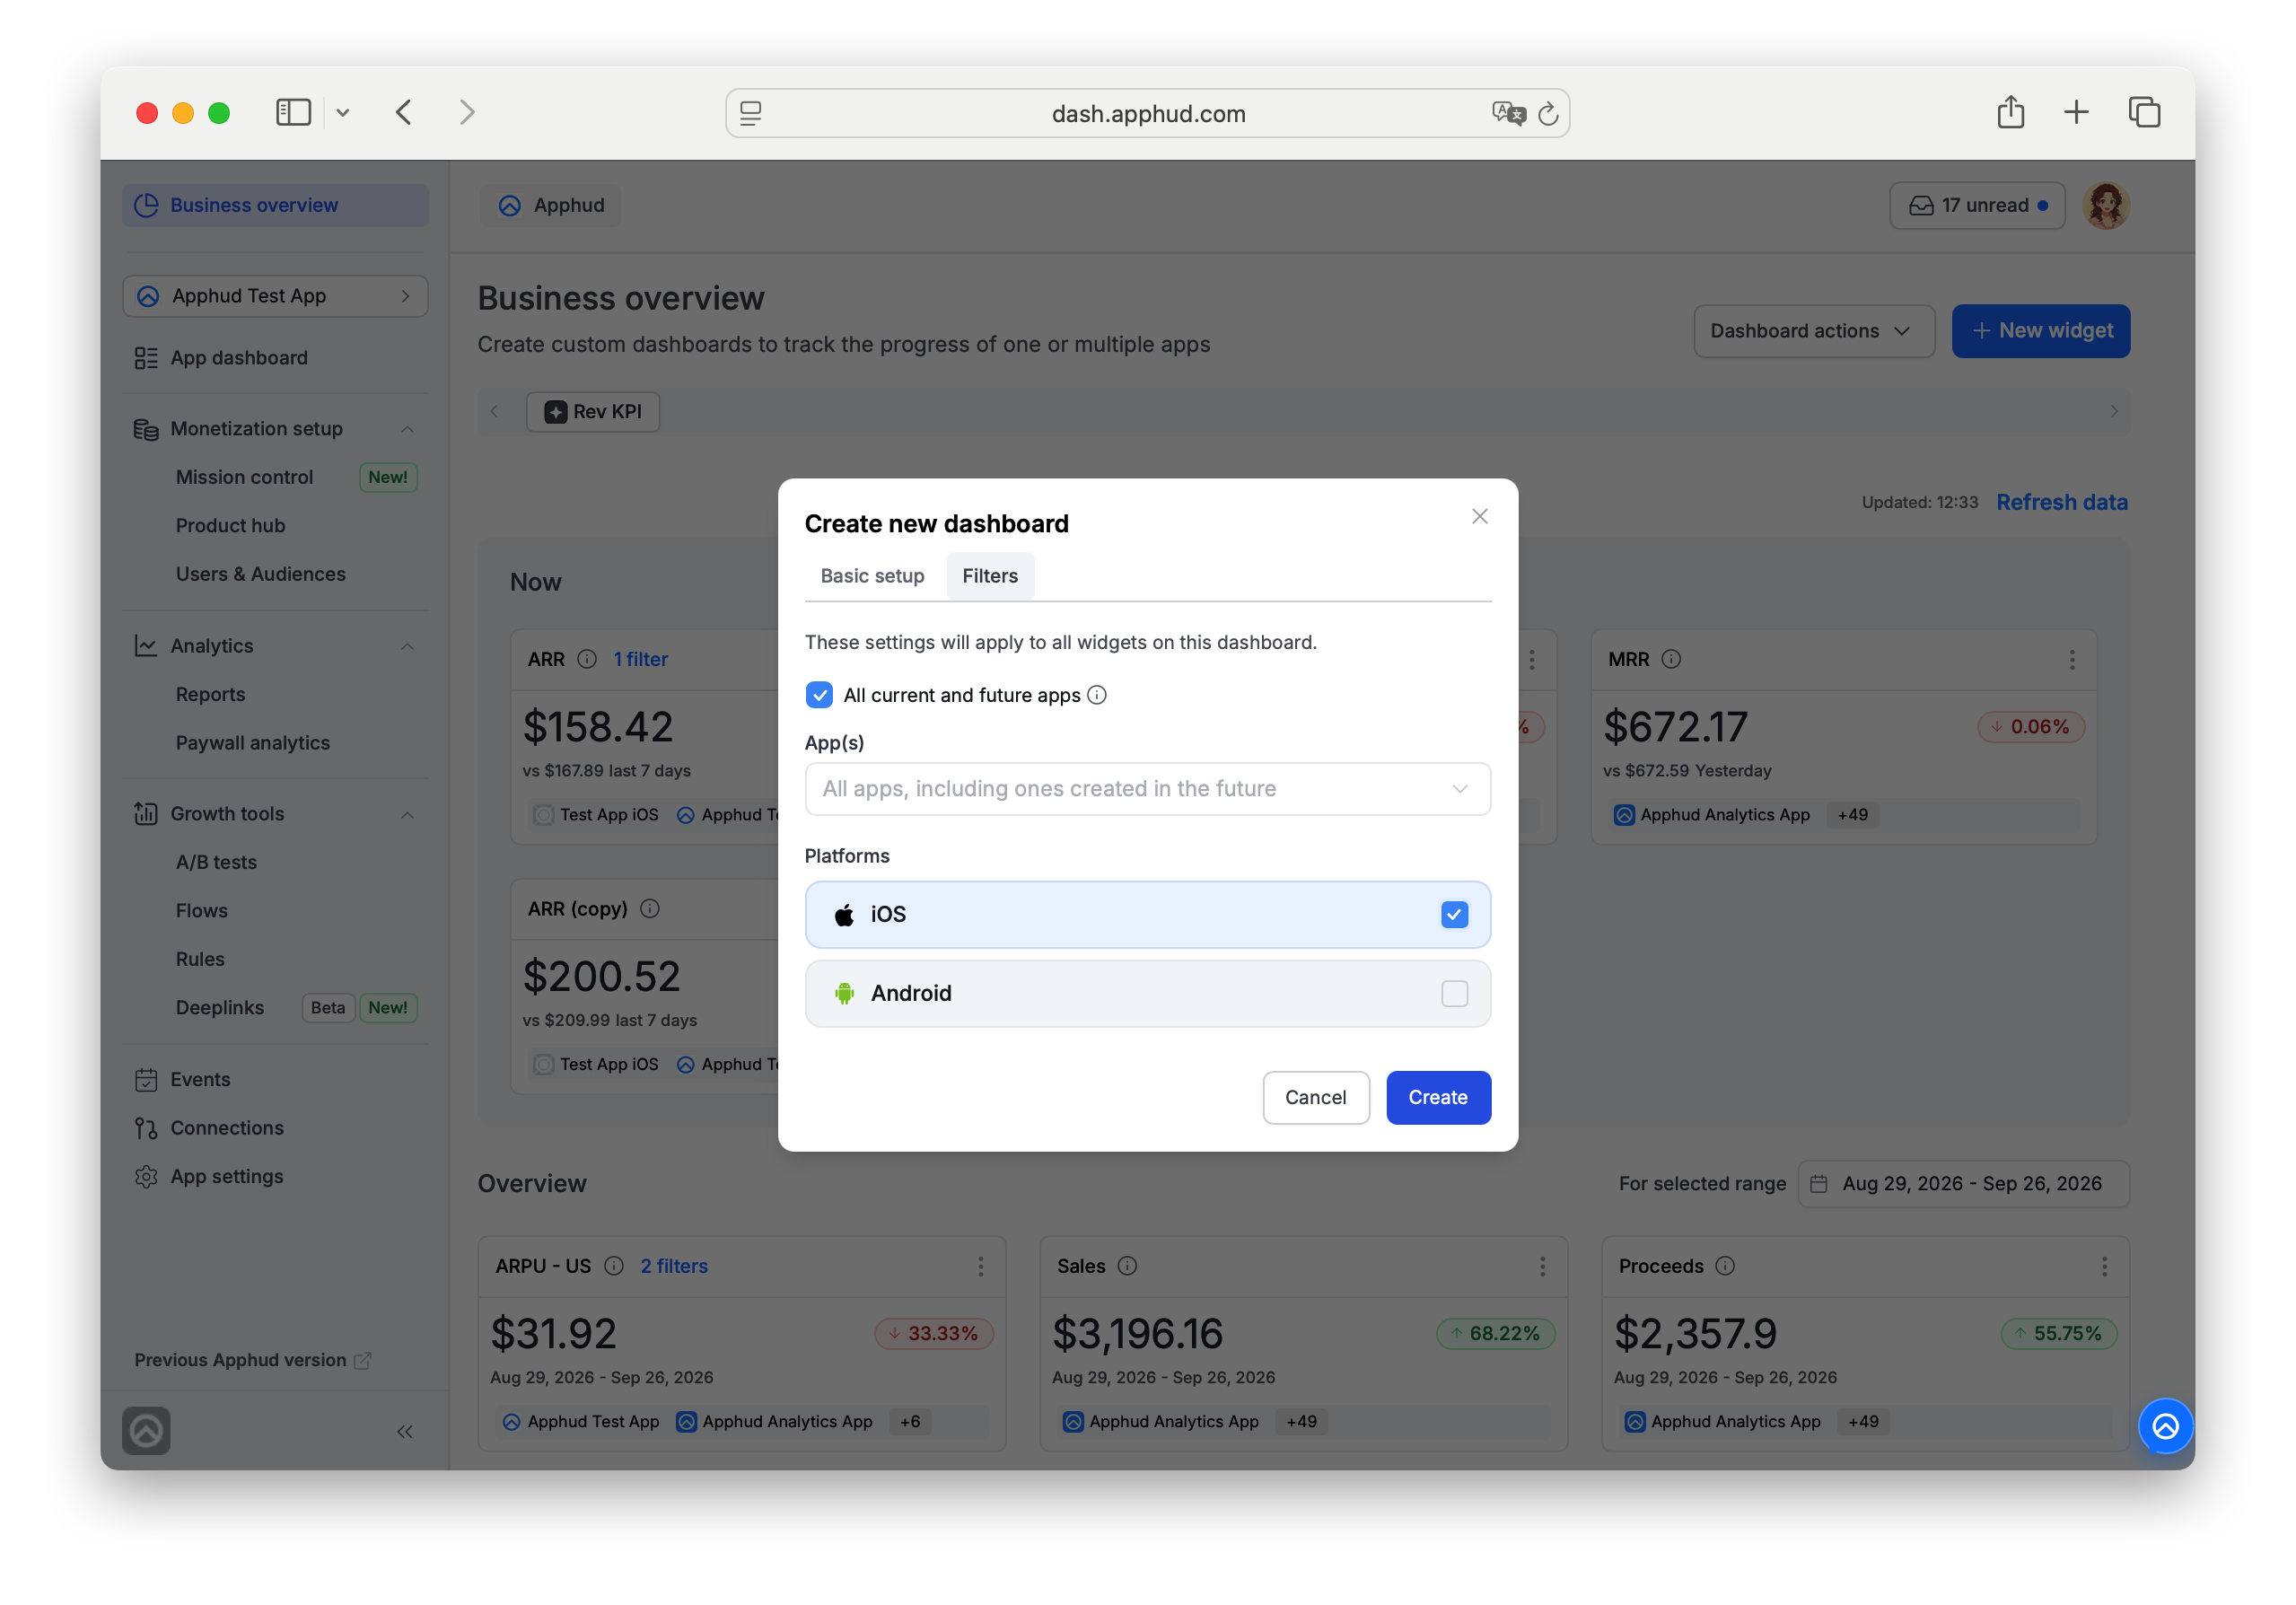
- All current and future apps — a checkbox that scopes the dashboard to every app in the organization, including apps created later. Turning it on locks the App(s) field to "All apps, including ones created in the future" and clears any specific apps you'd picked. Turning it back off restores the apps you had selected before turning it on.
- App(s) — pick one or more specific apps instead, when the checkbox above is off.
- Platforms — iOS / Android.
New widgets prefill their App(s) from this dashboard scope. Whether a widget can override it depends on the scope:
| Dashboard scope | Can a widget change its Apps? |
|---|---|
| All current and future apps | No — inherited from the dashboard, locked |
| One or more specific apps | Yes — the widget can pick any subset of the dashboard's apps in addition to those included by default |
This is useful when a dashboard covers several apps and you want to compare them side by side, one widget per app — or simply narrow a widget to fewer apps than the dashboard's full scope.
Dashboard actions
Use Dashboard actions to manage dashboards.
Available actions:
- Create new dashboard — creates another dashboard.
- Edit — opens the dashboard in Basic setup (name, time zone, ID for API access) and Filters (Apps and Platforms scope, see Dashboard scope) tabs.
- Make default — makes the current dashboard the default Business Overview dashboard, so it is shown on the first tab of Business Overview, marked with a star icon.
- Duplicate — creates a copy of the current dashboard, including all its widgets and their app configuration. You're prompted for a name for the copy (defaulting to "{name} (copy)") before it's created.
- Delete dashboard — deletes the current dashboard, along with all widgets in it. Deleting a dashboard does not delete any other data.
Add a widget
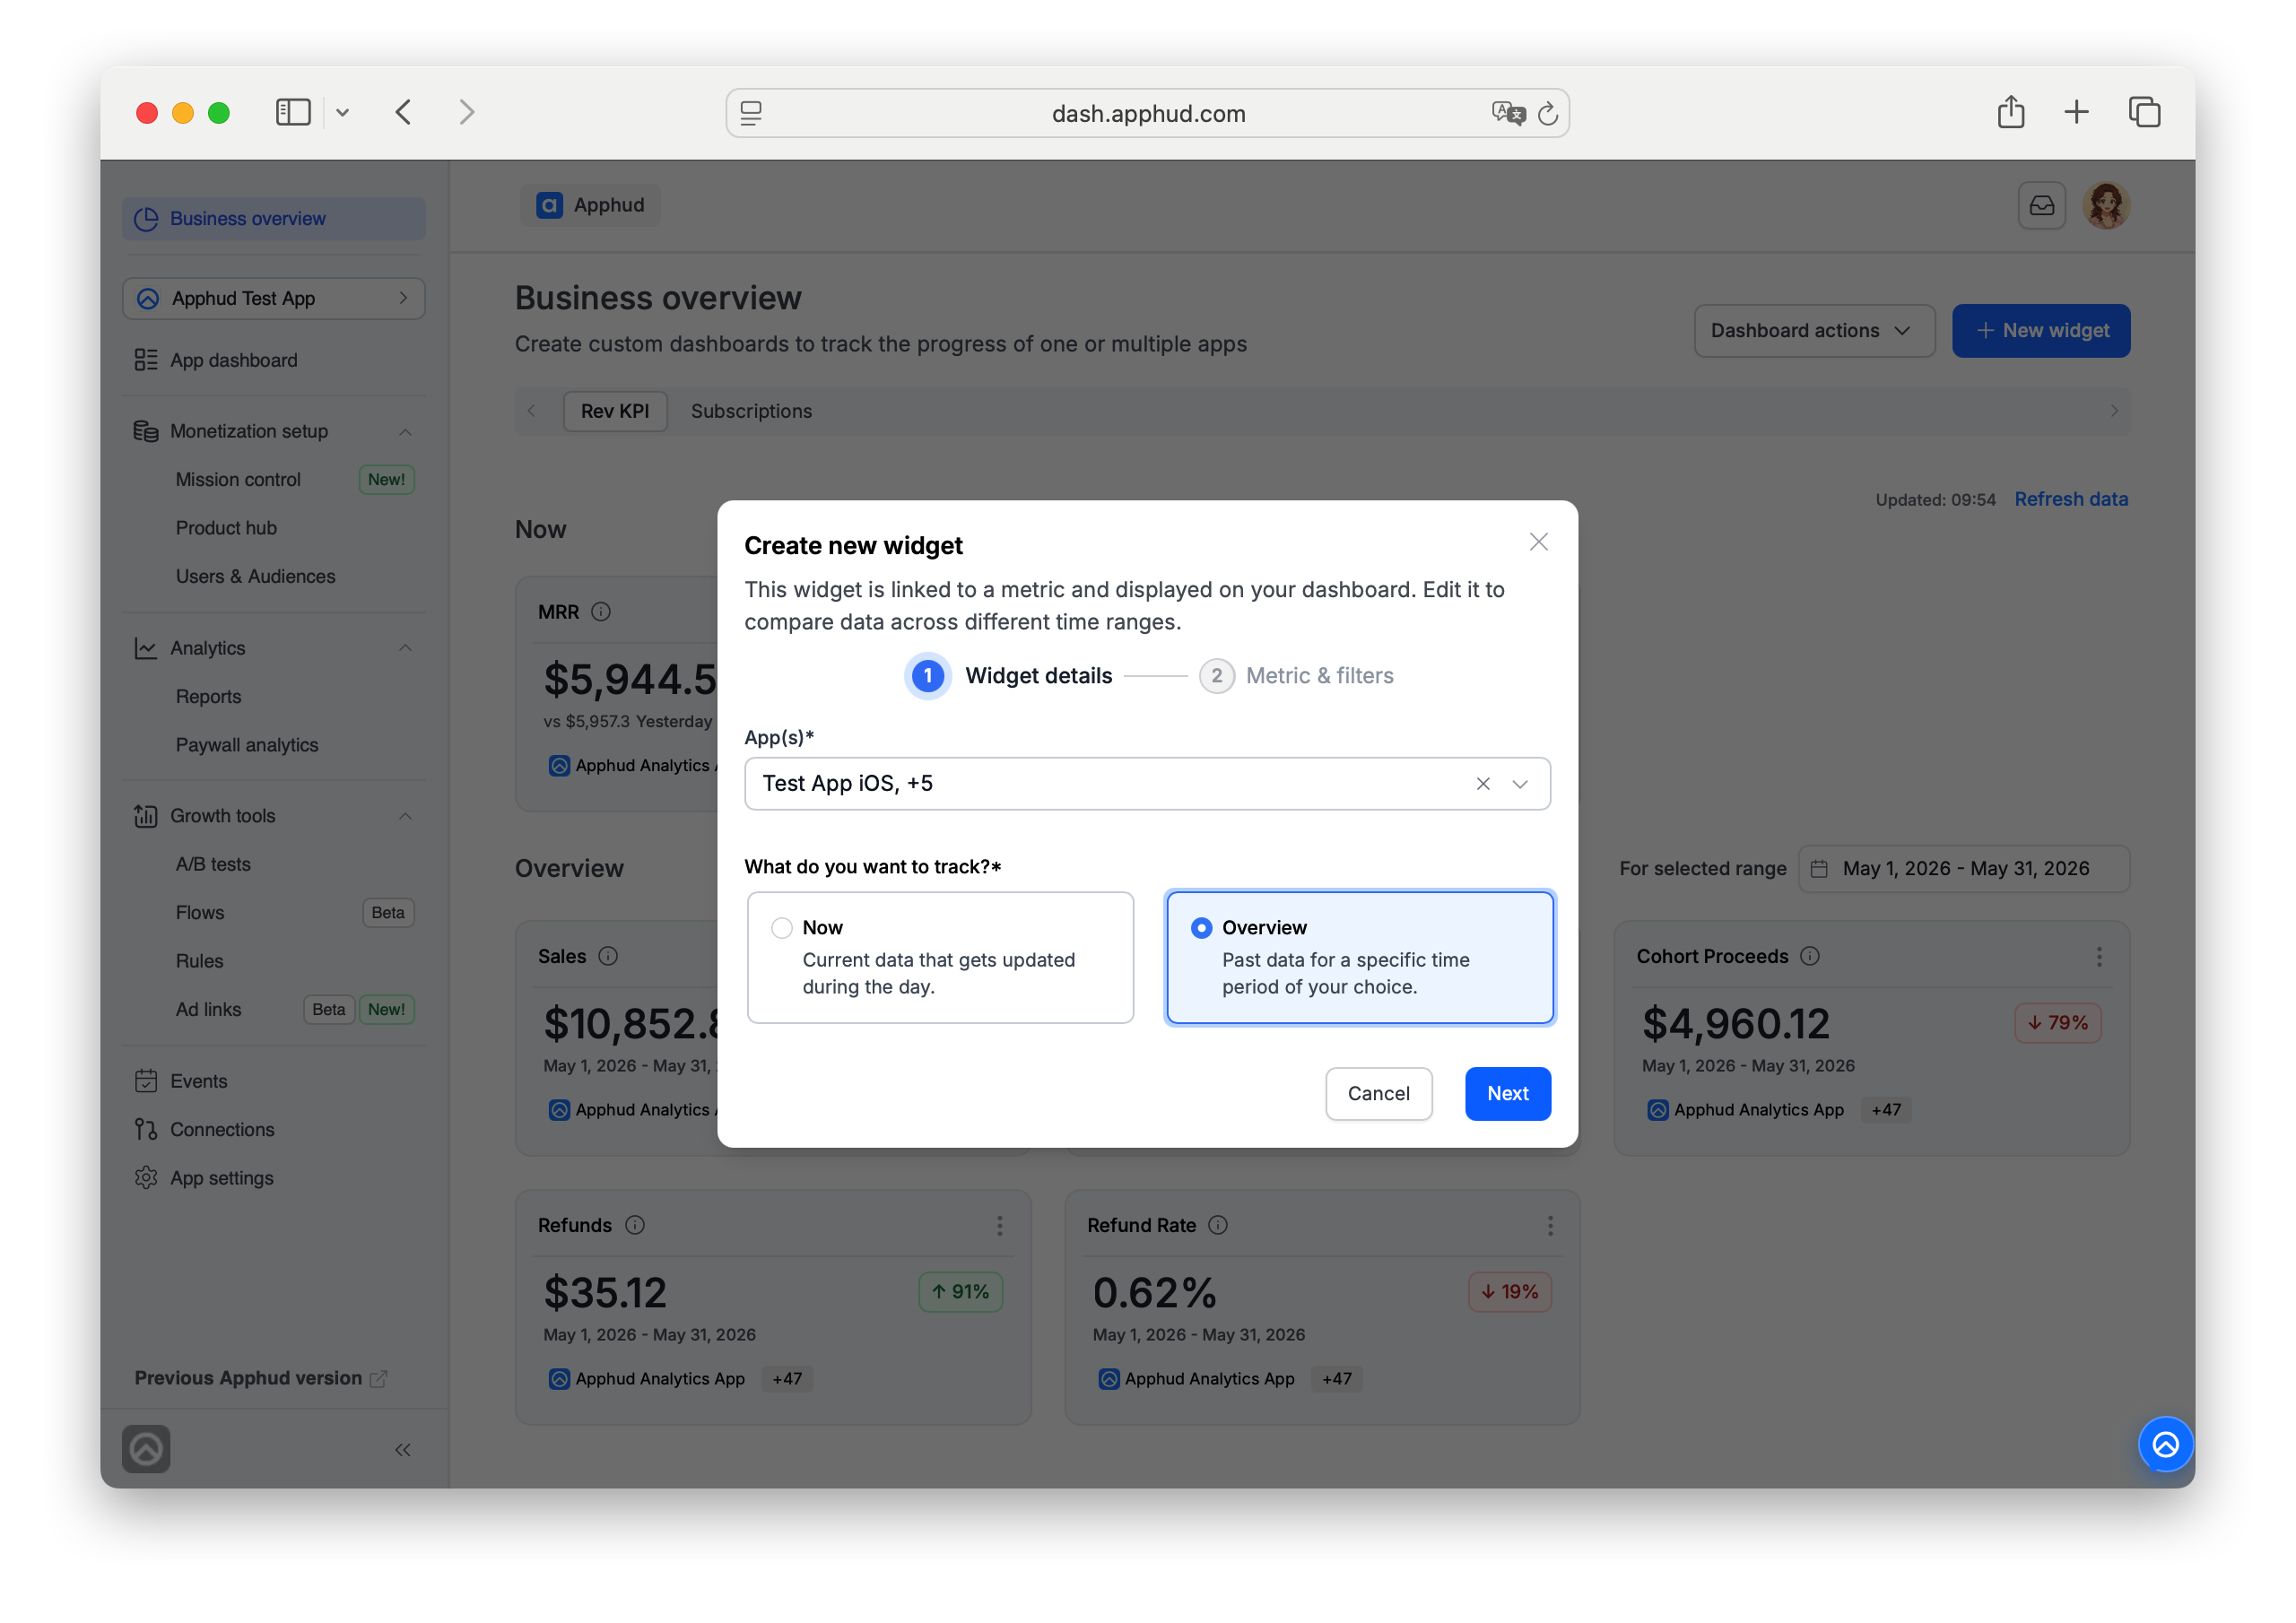
Adding a widget is a two-step flow: Widget details, then Metric & filters.
Step 1 — Widget details
- Open a dashboard you'd like the widget to be hosted on.
- Click New widget.
- Select the apps whose data should be included. This is prefilled from the dashboard's scope, and may be locked — see Dashboard scope.
- Choose what you want to track:
- Now — current data that gets updated during the day.
- Overview — past data for a specific time period of your choice.
- Click Next.
Step 2 — Metric & filters

- Select the metric. Check below for detailed Now and Overview metrics-type description.
Note that Filters selection is disable till a metric is chosen. - Enter the widget name.
If a widget will use filters, it is usually helpful to include the filtered segment in the widget name. - Optionally, add filters.
- For Overview widgets: pick the widget type — see Widget type below — and the default time period: Today, Yesterday, Last 7 days, This month, Last month, or Last 3 months.
- For Now widgets: select the comparison period for the trend, under Compare the current data with: Yesterday (default), 7 days earlier, or 30 days earlier.
- Click Create.
The new widget is added to the end of its own group — see Widget type below.
Widget apps
Each widget can calculate data for one, multiple, or all apps available in the company, within what the dashboard's scope allows — see Dashboard scope.
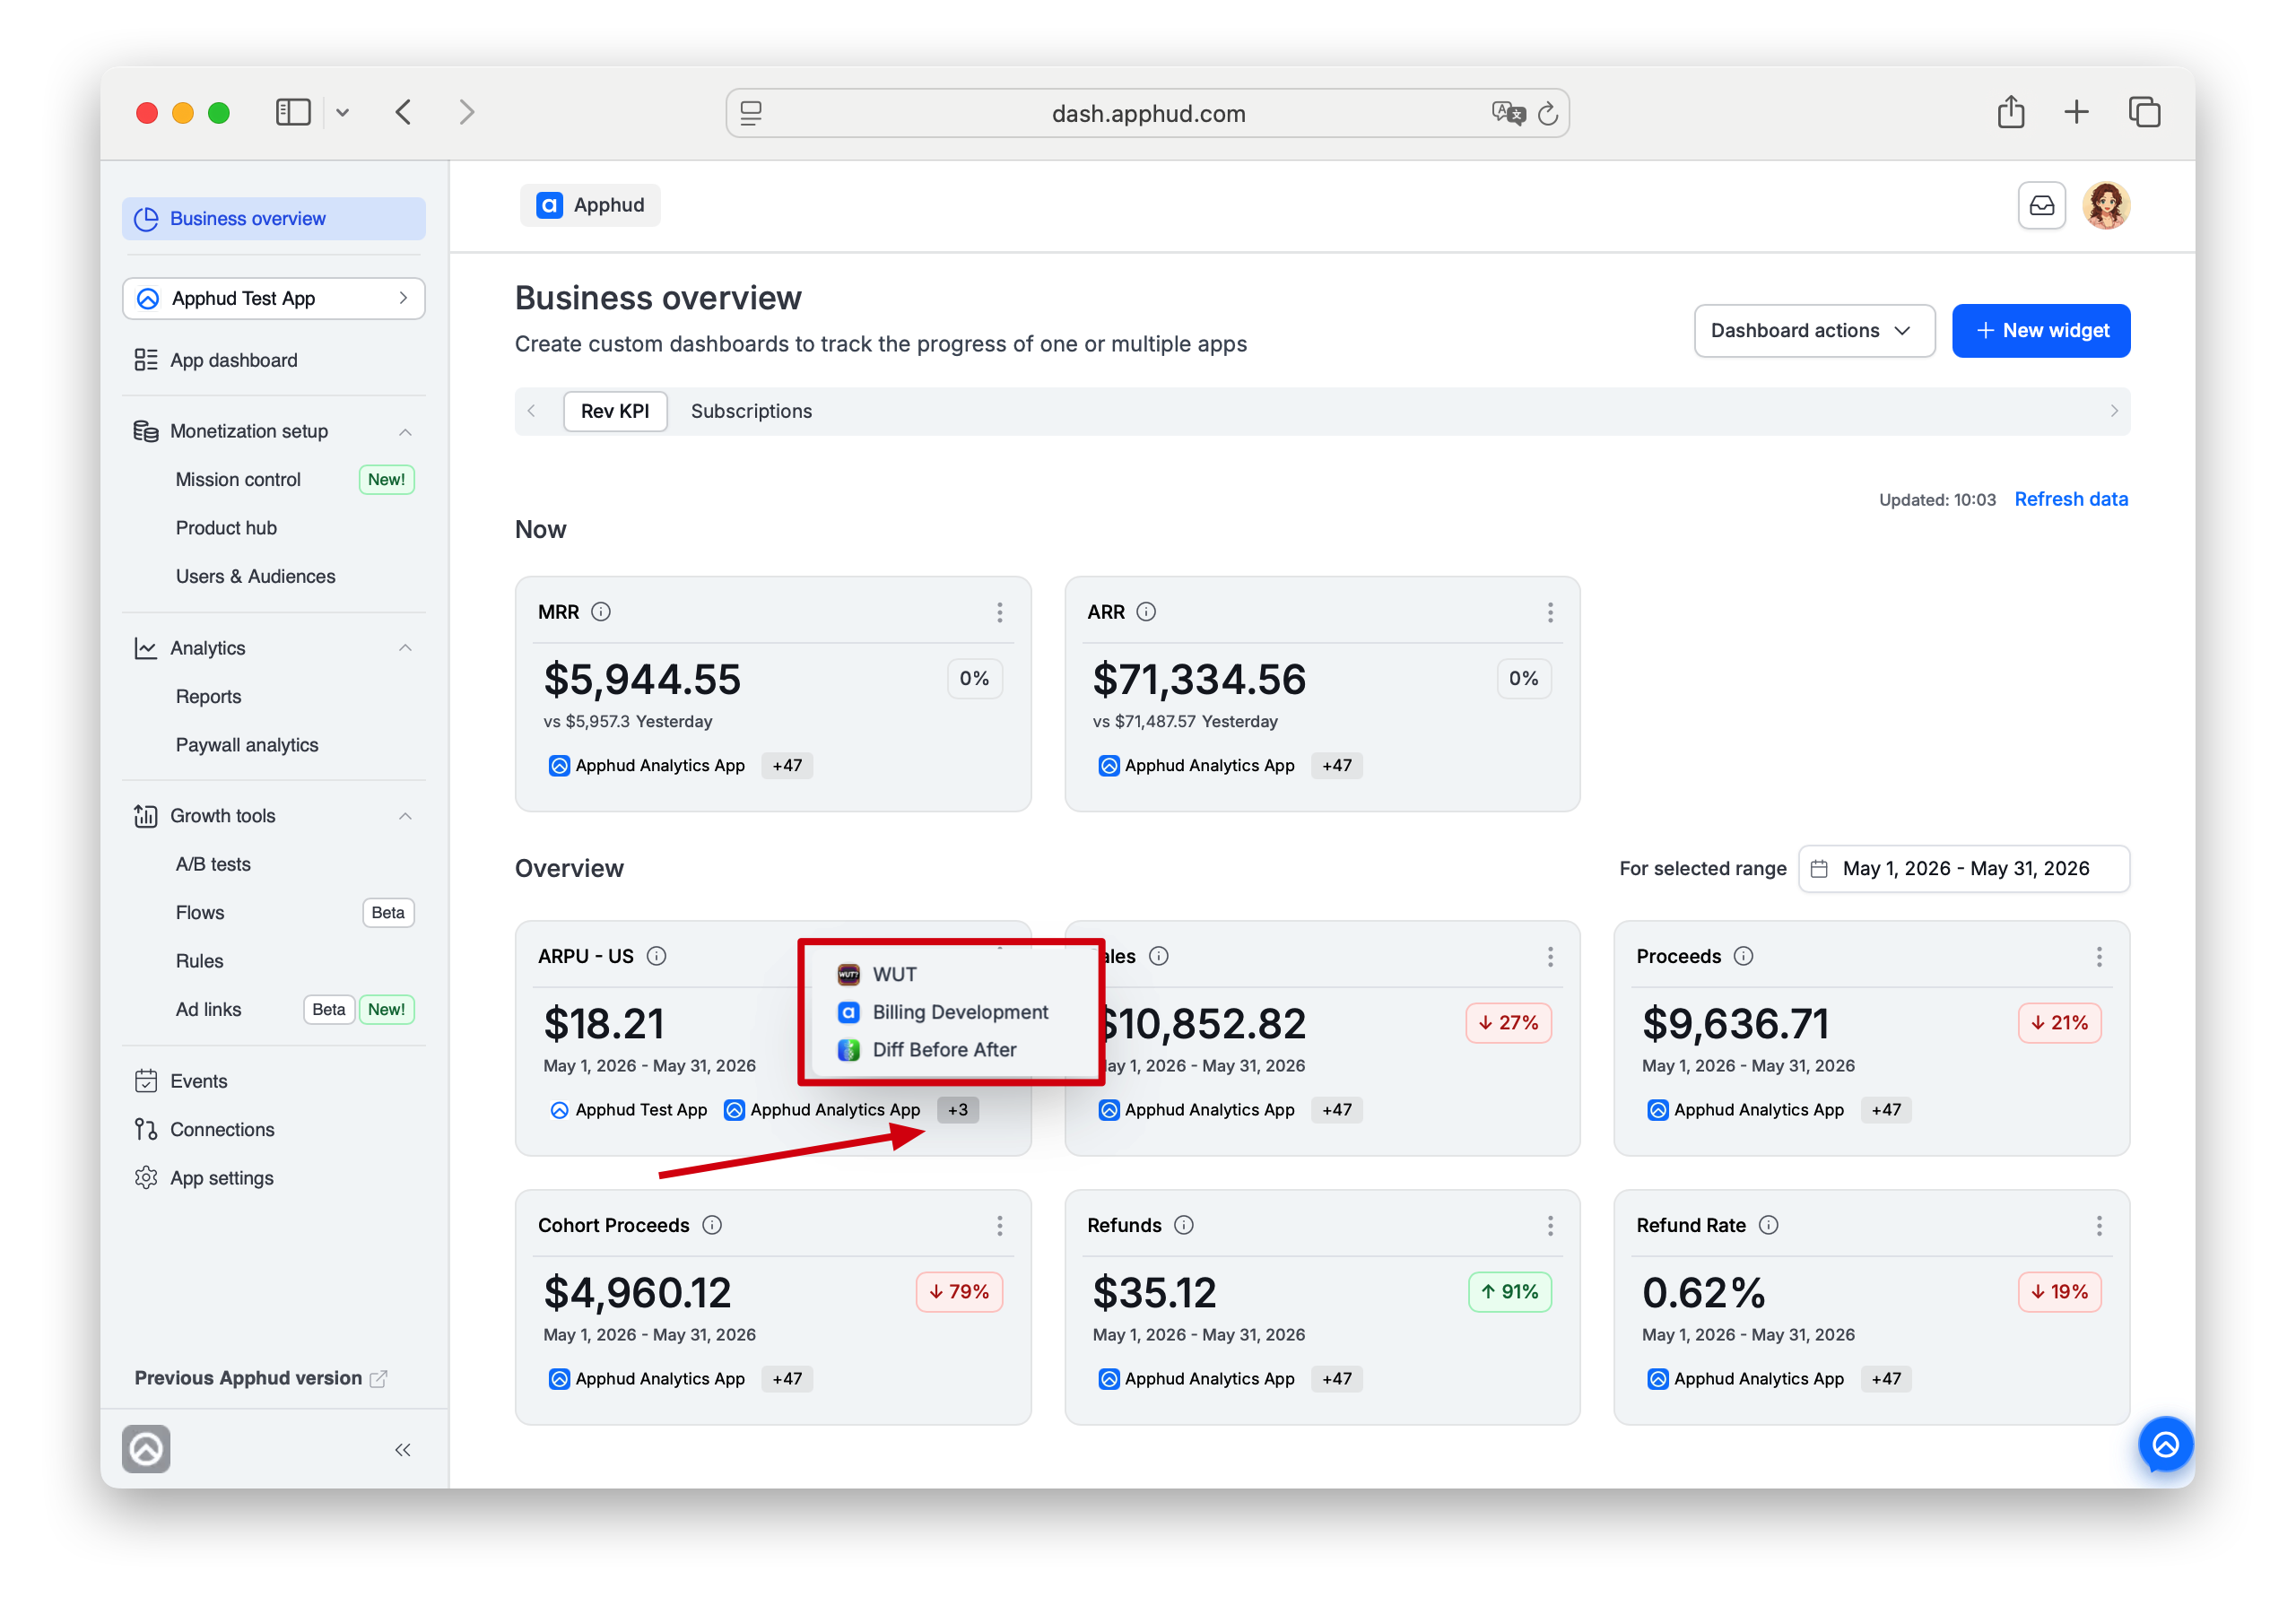
A saved widget shows selected apps under the metric value.
If many apps are selected, the app list may be collapsed and shown with an additional app count. By mouseover on this label, the list of all selected apps will be shown.
Widget type
Available for Overview widgets only:
- Number — a single value with a trend indicator versus the previous period (default, matches the classic widget look).
- Line chart — plots the metric over the selected period as a line chart.
- Bar chart — plots the metric over the selected period as a bar chart.
Now widgets are always shown as a single number — chart display types aren't offered for them, since a Now metric is a live current-state value, not a historical series to plot.
Two widget groupsNumber widgets and Chart widgets (line and bar charts) are always displayed as two separate groups — a grid of Number widgets on top, a grid of Chart widgets below.
This grouping is fixed: widgets can't be reordered or interleaved across groups, only within the same one — see Reorder widgets.
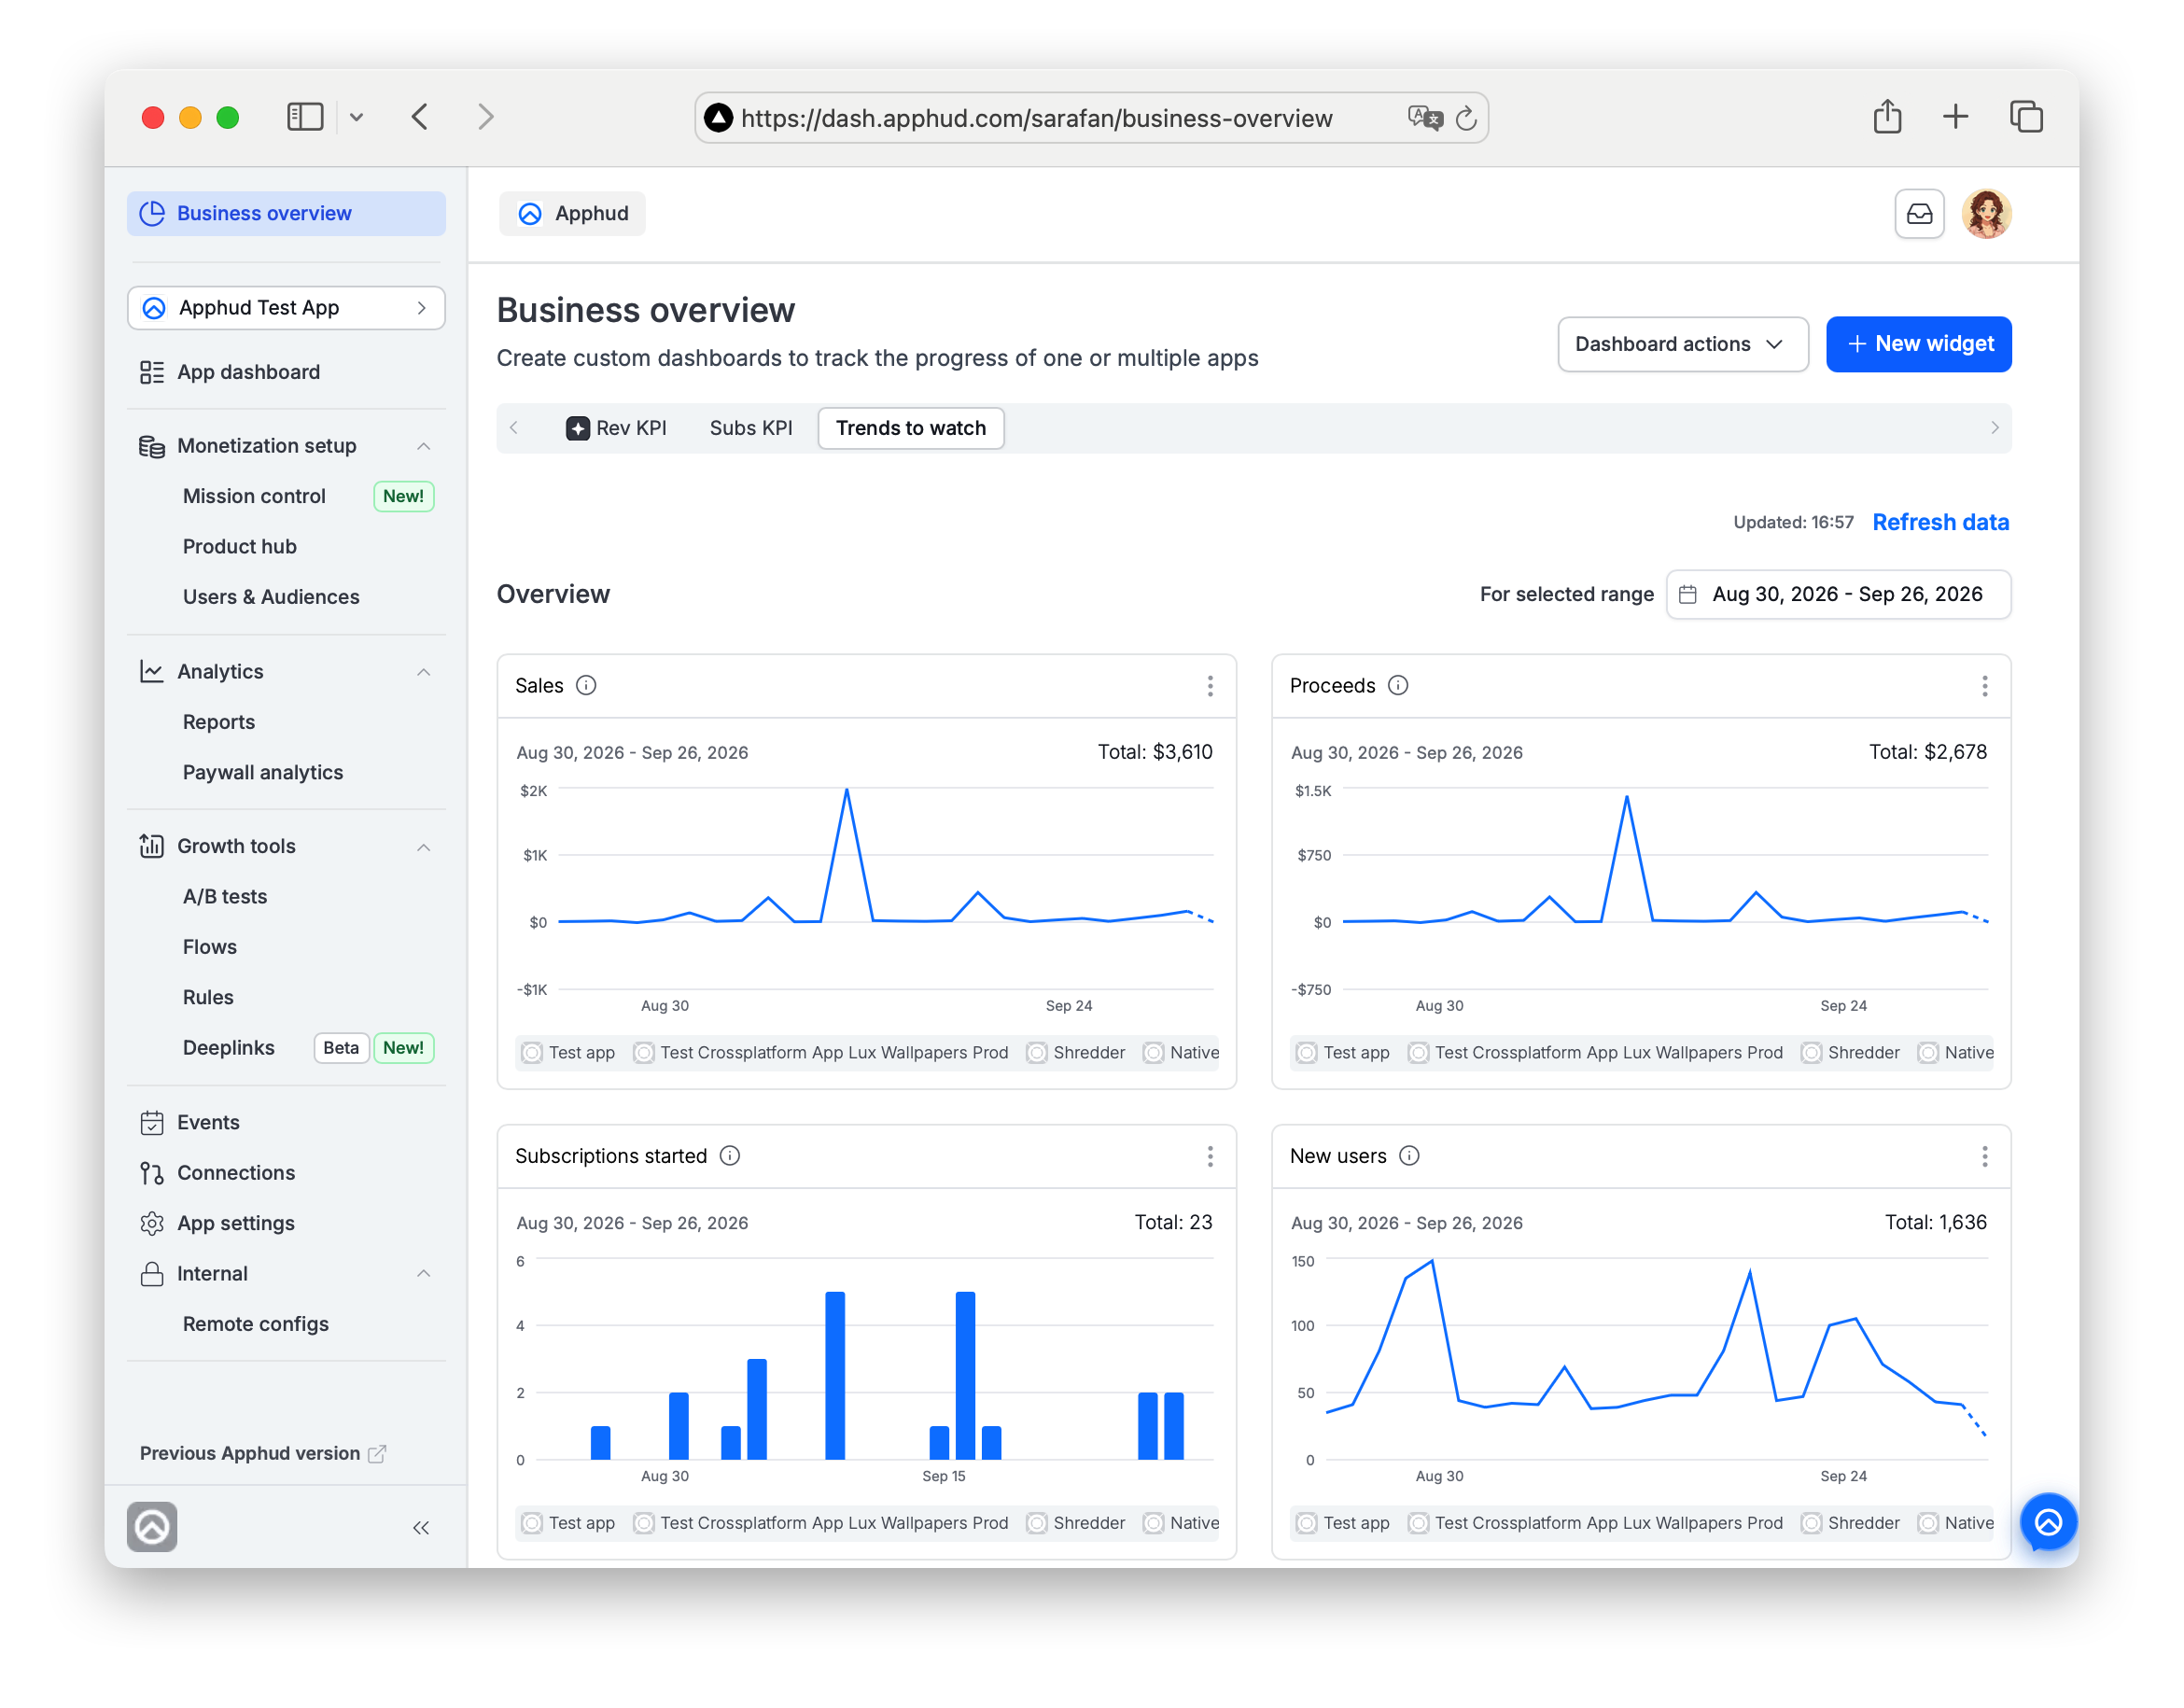
Hover over a point on a line or bar chart to see the exact value for that period and its change versus the previous period (the previous day, week or month, depending on how the chart is grouped). For metrics where a rise is a negative outcome, such as refunds and billing issues, a rise is shown in red. The current period is still being collected, so the last segment of a line is dashed and the last bar is hatched.
Widget filters
Filters narrow the data included in a widget.
Filters available in Business Overview widgets are consistent with those used in other analytics reports. You can find the full list of available filtering parameters here.
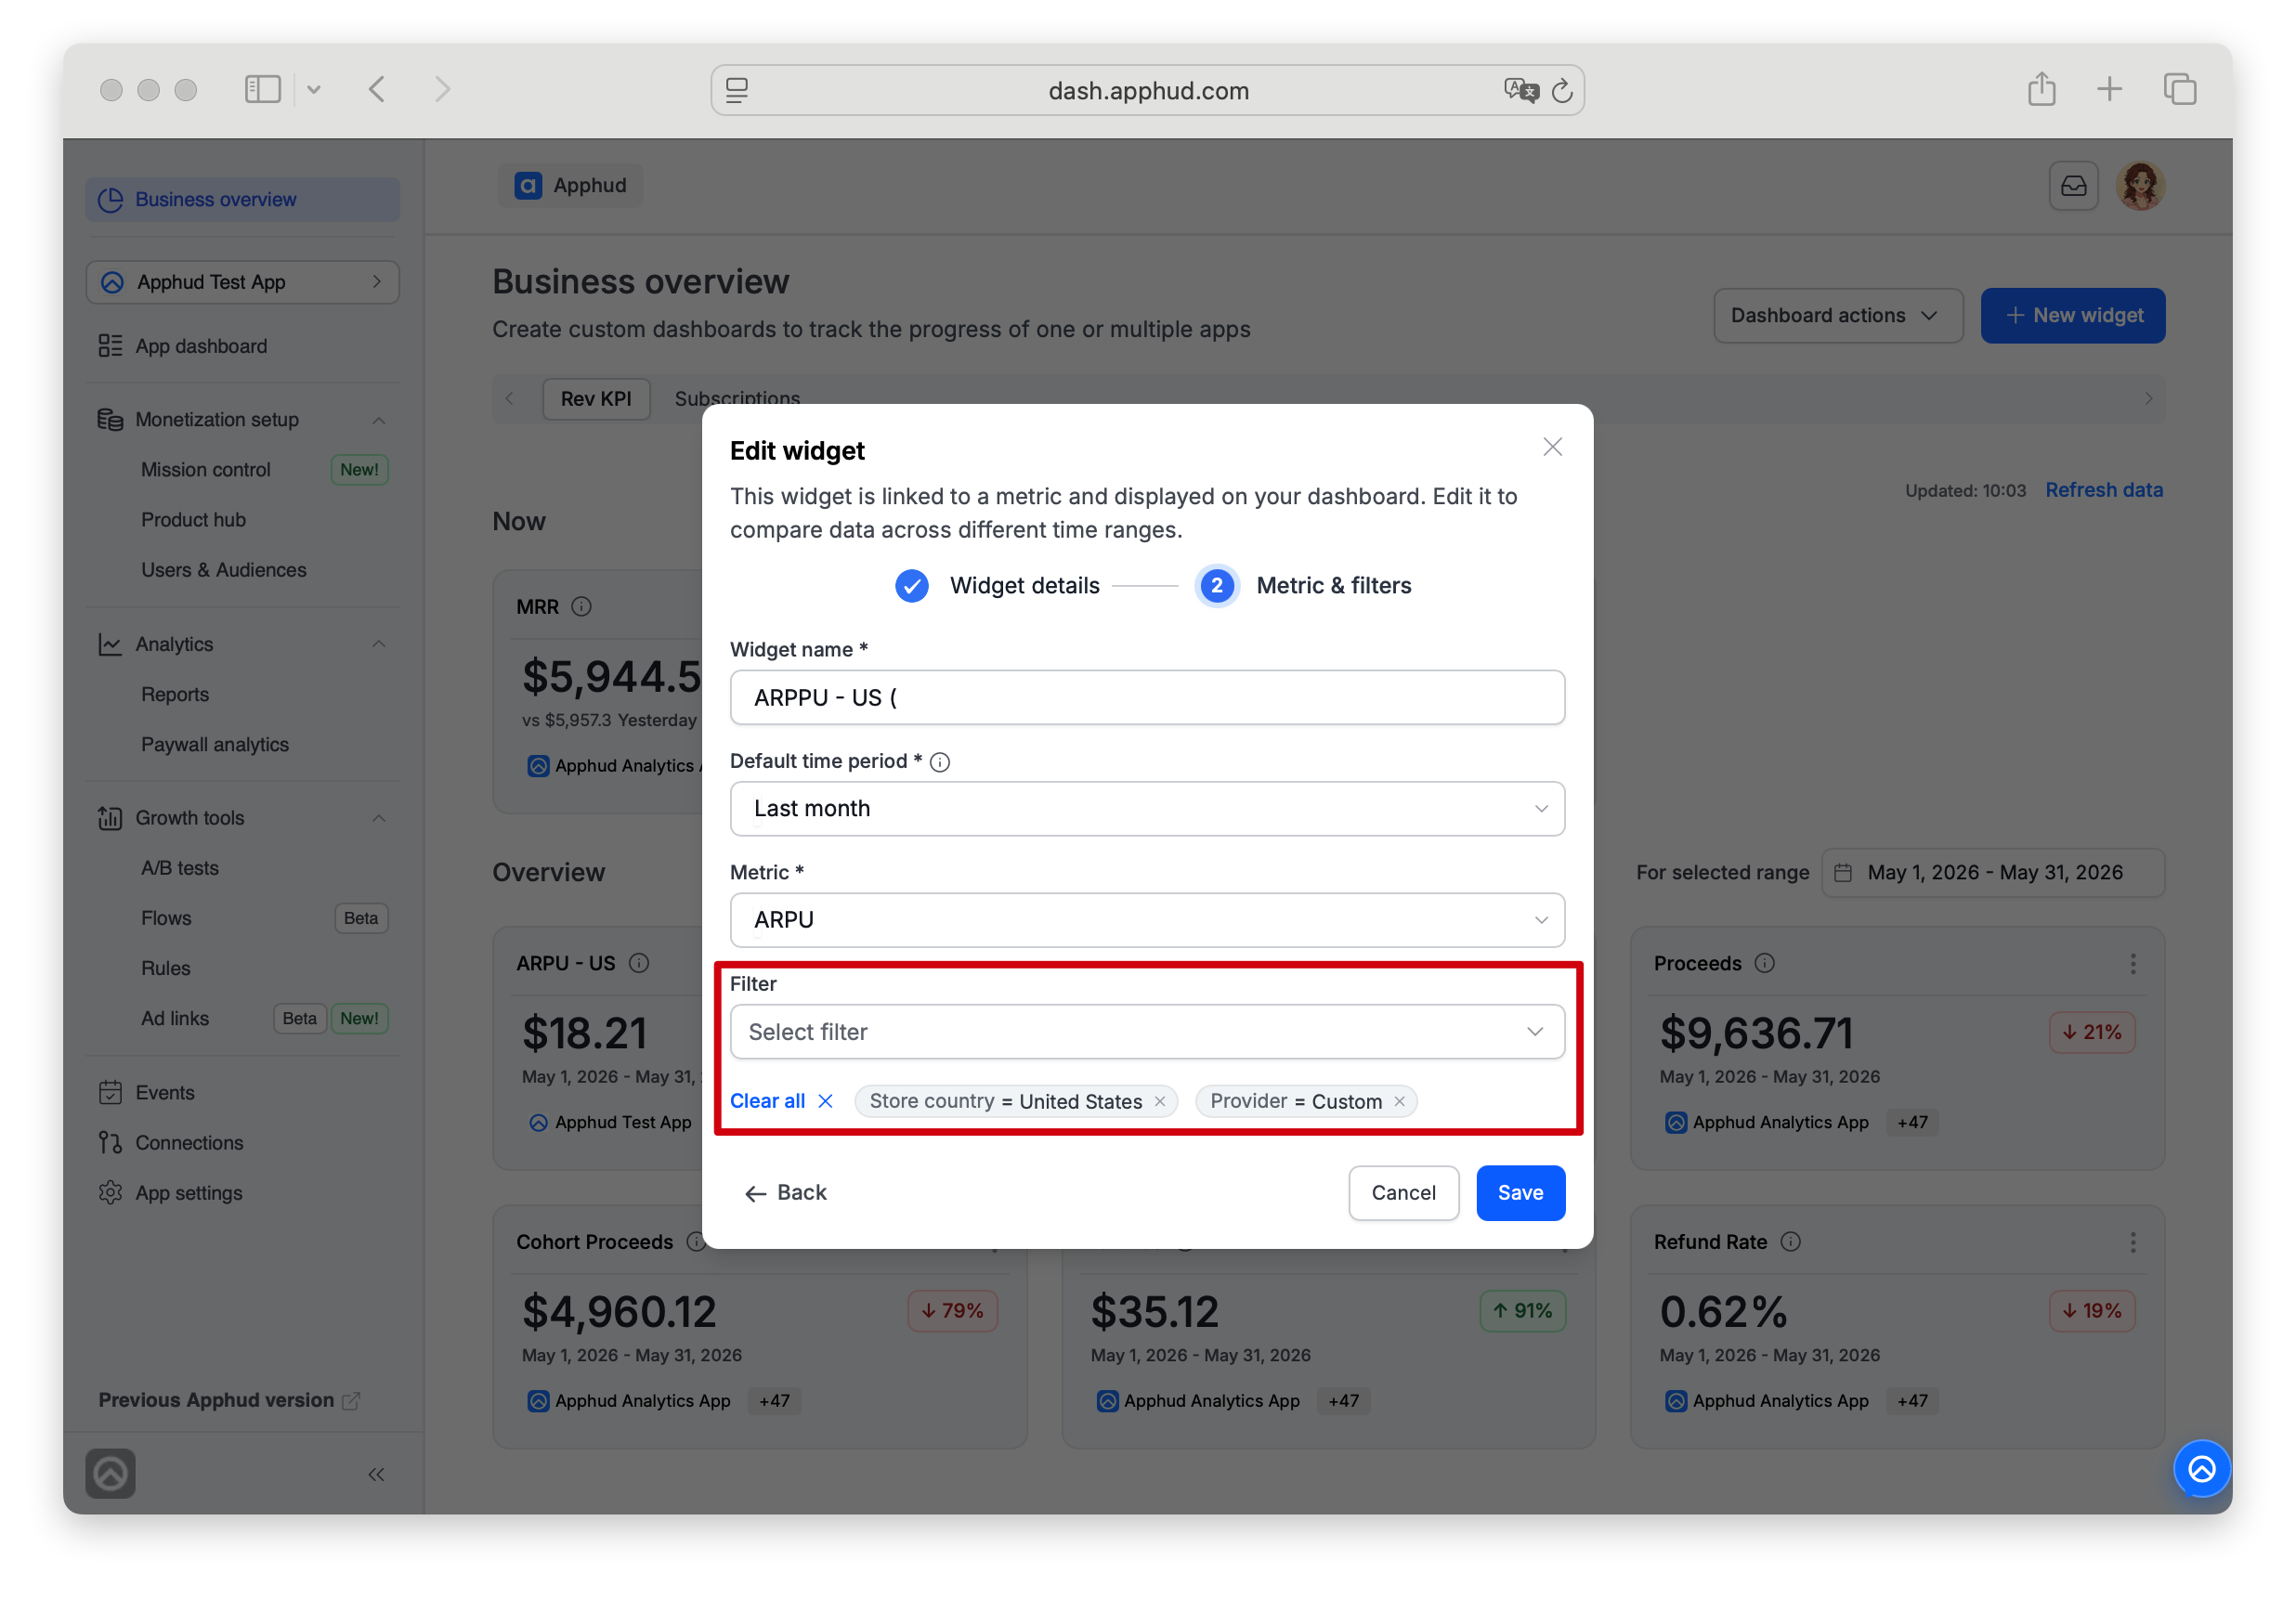
Applied filters are shown as chips during a widget setup.
On a dashboard, a widget with filters will show a filter count near the widget title, for example 2 filters. Click the label to see the parameters and selected values.
For widgets with multiple apps, the list of available user property keys is merged across the selected apps. If one of the selected apps does not have a specific user property key, that app simply may not contribute matching records for this filter.
NotePlease note that all filters are available when configuring a widget. However, not every filter is meaningful for every metric.
Some metrics are calculated on a user level, while others are based on subscription events or transactions.
Applying a filter that does not match the metrics underlying data type may result in empty or misleading values.For example, such metrics as New Users, ARPU is calculated on a user level. Applying a Product filter may not produce meaningful results, and the widget will show zero value. If a widget shows no data or unexpected values, review the selected filters and make sure they match the metric logic.
Filters are applied per widget and do not affect other widgets on the dashboard.
Now metrics
Metrics of Now type show the current state at the time the dashboard data was loaded or refreshed.
General
| Metric | Description |
|---|---|
| MRR | MRR (Monthly Recurring Revenue) represents recurring proceeds revenue normalized to a monthly amount, after deducting the respective app store's commission and VAT. |
| ARR | ARR (Annual Recurring Revenue) represents recurring proceeds revenue normalized to an annual amount, after deducting the respective app store's commission and VAT. |
| In billing grace period | Number of currently active subscriptions in a billing grace period state. |
| In billing retry period | Number of currently active subscriptions in a billing retry period state. |
No period comparison for Billing Grace / Retry widgetsIn billing grace period and In billing retry period don't keep historical snapshots, so their widgets show only the current count — no trend arrow or comparison percentage like other Now widgets.
Subscriptions
| Metric | Description |
|---|---|
| Active Paid Subscriptions | Number of currently active paid subscriptions, including subscriptions with introductory pricing or paid promotional offers; and excluding subscriptions in free trials, grace periods, or billing retry states. |
| Active Trials | Number of currently active subscriptions in a free trial state. |
| Active Intro Offers | Number of currently active subscriptions in a paid introductory pricing state. |
| Active Promo Offers | Number of currently active subscriptions in a paid promotional offer state. Available on iOS only. |
Triple widgets
Subscriptions metrics render as triple widgets — a single card showing three numbers at once instead of one: the total active count, the auto-renewing portion, and the non-renewing portion (total = auto-renewing + non-renewing).
Unlike other Now widgets, triple widgets have no comparison with a previous value — no trend arrow or percentage.
Users
| Metric | Description |
|---|---|
| DAU | Number of unique active users over a fixed rolling 24-hour window. Not affected by the widget's time period or the global date picker. |
| WAU | Number of unique active users over a fixed rolling 7-day window. Not affected by the widget's time period or the global date picker. |
| MAU | Number of unique active users over a fixed rolling 30-day window. Not affected by the widget's time period or the global date picker. |
Overview metrics
Overview metrics show historical data for a selected period.
Available Overview metrics are grouped by business area.
Money
| Metric | Description |
|---|---|
| Gross Revenue | The total amount billed to customers for purchasing subscriptions and non-renewing purchases before accounting for refunds, taxes, and app store commissions. |
| Sales | The total amount billed to customers for purchasing subscriptions and non-renewing purchases after deducting refunds. |
| Proceeds | Estimated revenue the developer receives after deducting store commissions, refunds, and VAT. |
| Cohort Proceeds | Proceeds revenue generated by new users who installed the app within the specified dates. |
| Refunds | The total amount refunded to customers during the selected period, including refunds processed through customer support and prorated refunds during subscription upgrades. |
| Refund Rate | Percentage of transactions that were refunded out of the total transactions billed during the selected period. |
| Prevented Refund Requests | Dollar amount of refund requests that Apphud prevented. Requires the Win Back Refund Requests add-on to be enabled. |
Average Revenues
| Metric | Description |
|---|---|
| ARPU | Average revenue generated from all users, including total revenue from subscriptions and non-renewing purchases. |
| ARPPU | Average revenue generated from paying users, including total revenue from subscriptions and non-renewing purchases. |
| ARPC | Average revenue generated from customers, including both paying users and users on free trials. Includes total revenue from subscriptions and non-renewing purchases. |
Events
| Metric | Description |
|---|---|
| Subscriptions started | Number of Subscription Started events within the selected period. |
| Trials started | Number of Trial Started events within the selected period. |
| Trials canceled | Number of Trial Canceled events within the selected period. |
| Trials converted | Number of Trial Converted events within the selected period. |
| Intro Subs Started | Number of Intro Started events within the selected period. |
| Promo Subs Started | Number of Promo Started events within the selected period. |
| Billing Issue | The count of Billing Issue events that occurred within the selected dates. A Billing Issue event is unique to each subscription period and does not represent the total number of charge attempts made by the bank. |
| Resolving Billing Issue | The total number of subscription recoveries from any Billing Issue state, regardless of potential future refunds. The value may change if there are Pending Billing Issues. |
| On Time Renewals | The count of successful subscription renewals within the selected dates, including trial conversions and Google Play transactions that resumed from a paused state, regardless of potential future refunds. Excludes initial purchases and other user-initiated transactions such as prorated upgrades. Only renewal events expected at the end of an active subscription period are counted. |
| On Time Trial Conversion | The number of free trials that converted on time, meaning before or at the end of the trial period, regardless of potential future refunds. Google Play trial conversions from a paused state are also included. |
Users
| Metric | Description |
|---|---|
| New Users | The number of users who installed the app for the first time during the selected dates. |
| Redownloads | The number of app reinstalls during the selected dates. |
| Total Downloads | The combined number of new users and app reinstalls during the selected dates. |
| Active Users | The number of unique users who had at least one active session during the selected dates. For a fixed daily/weekly/monthly active-user count that ignores the selected period, use the Now metrics DAU / WAU / MAU instead — see Now metrics → Users. |
Conversion rates
| Metric | Description |
|---|---|
| Install-to-trial CR | Conversion rate from new users to a free trial. |
| Install-to-paid CR | Conversion rate from new users directly to a paid subscription. |
| Trial conversion rate | The percentage of total trial conversions out of the total number of free trials. |
Refresh data
The Refresh data button updates Now metrics. Use it whenever you need the latest current-state values.
After you open a dashboard, widgets in the Now section display values as of the moment the data was last loaded. This timestamp is shown on the dashboard (for example, Updated: 14:59) along with your browser time zone. Note that the browser time zone may differ from both the project and dashboard time zones. It is used only to help you understand how recent the displayed values are.
If data changes while the dashboard is open, Now widgets continue showing the previously loaded values until you click Refresh data.
Dashboard timeline
Overview widgets have time periods.
By default, the Overview section uses Per widget mode. In this mode, each Overview widget may use its own default period.
For example, the same dashboard can show:
- ARPU for Last 30 days
- Cohort Proceeds for Last 90 days
- Trials converted for Today
Use one period for all Overview widgets
You can select a global time range for the Overview section using the date picker in the top-right corner. Click the calendar control labeled Per widget (default) to open it.
Available options are the same as in Analytics reports and include predefined periods as well as a Custom Range.
When a global time range is applied, it overrides the default period for all Overview widgets in the section.
The global timeline affects Overview widgets only. It does not affect Now widgets.
The period you select is saved. It applies to every dashboard, including dashboards you create later, and stays after you reload the page. To return to each widget's default period, select Per widget.
Charts for most metrics can cover up to 31 days. Charts for MRR, ARR, Cohort proceeds, ARPU, ARPPU, ARPC, Trials converted, On-time renewals and On-time trial conversions work for any period. For any other chart, a longer period shows "No data found" with a message such as "chart period of 90 days is not allowed for widget billing_issue: maximum is 31 days". Number widgets are not affected.
To return to each widget's default period, open the date picker, select Per widget in the top-left corner, and apply the changes.
Manage Widgets
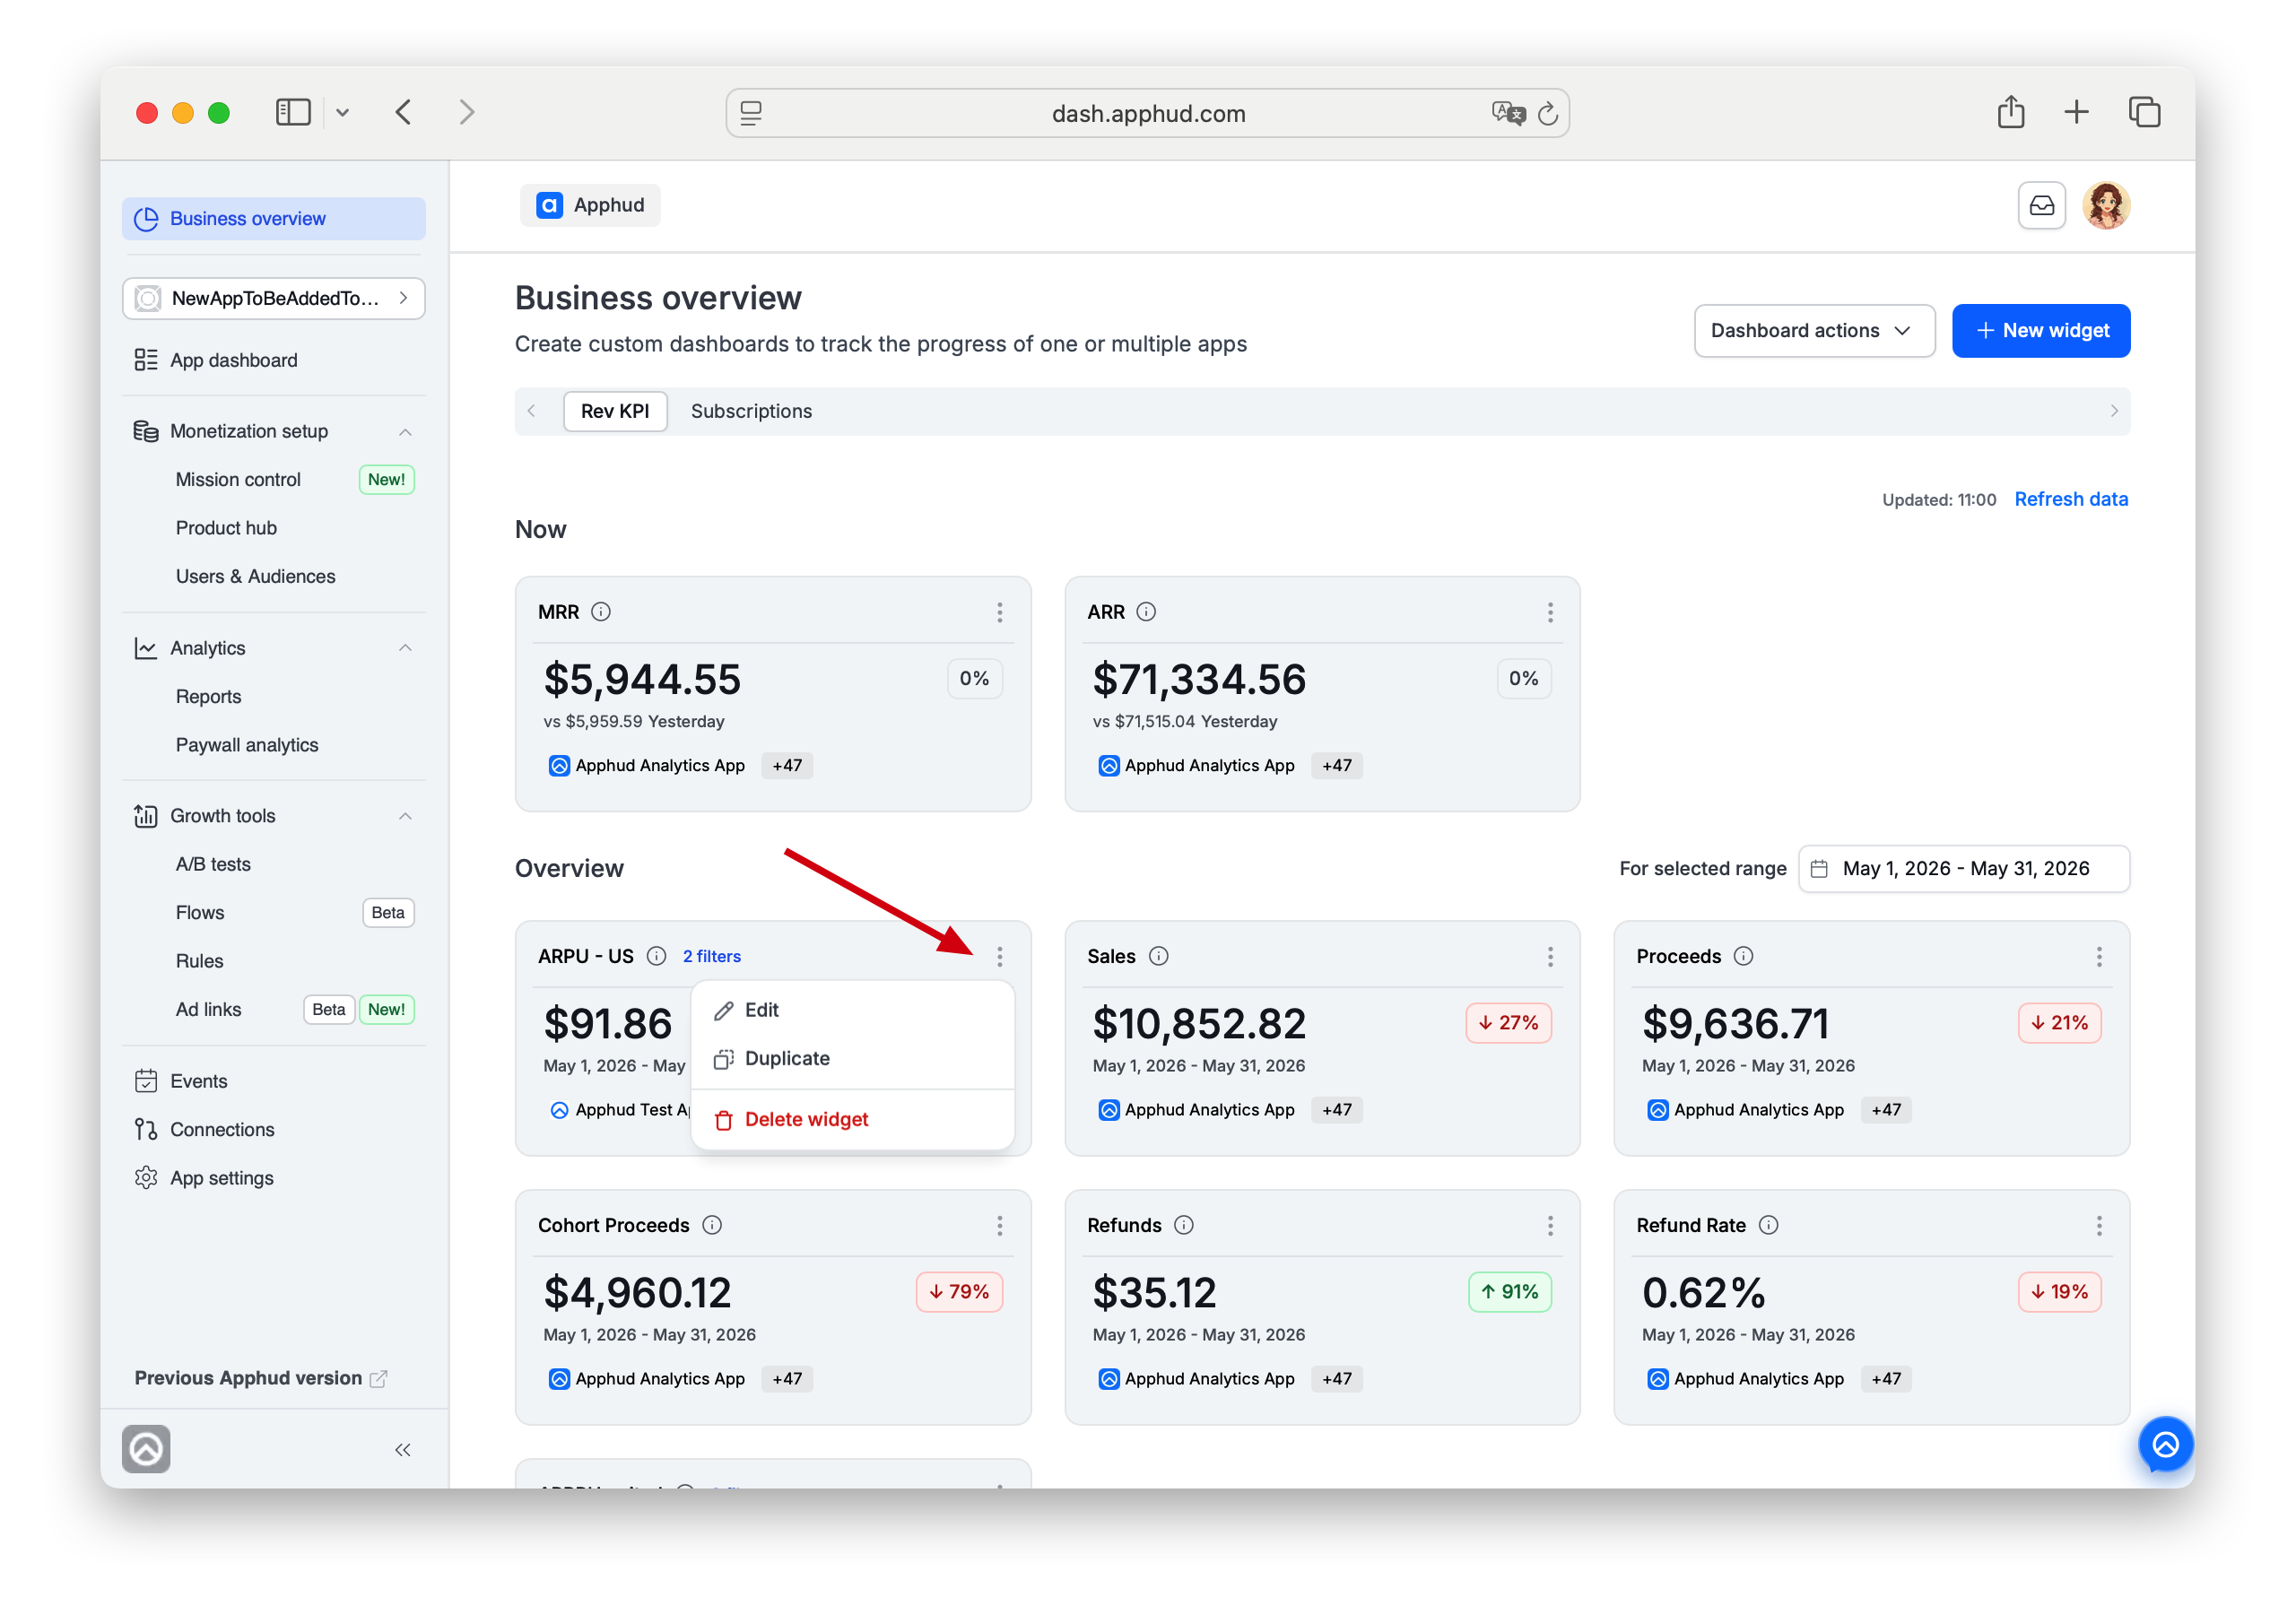
Use the widget actions menu (three-dot icon) to manage an existing widget.
Available actions:
- Edit — update widget configuration
- Duplicate — create a copy of the widget with the same configuration
- Delete widget — remove the widget from the dashboard
Edit widget
Editing a widget changes only that widget. Other widgets on the dashboard are not affected.
Depending on the widget configuration, you can update:
- widget name
- metrics
- time period
- filters
Limitations on editingPlease note that it's not possible to edit the chosen** metric type** for a widget.
If you need another type of a widget, please create a new widget instead of editing.
Reorder widgets
Widgets can be reordered by drag and drop, but only within their own group. Within the Overview section, widgets are displayed as two groups — a grid of Number widgets on top and a grid of Chart widgets (line and bar charts) below. Reordering works freely within each group, but a widget cannot be dragged across the boundary — for example, a line chart widget can't be moved above the Number-widgets group, no matter how far up you drag it.
To change a widget position:
- Hover over the widget title.
- Find the drag handle that appears before the title.
- Drag the widget to a new position within the same group.
The drag handle appears only on hover.
API access
Each dashboard and widget has a stable ID that can be used to fetch its data via the Apphud API.
Use API access to integrate Business Overview data into 3rd-party BI tools, your internal dashboards, scheduled reports (email or Slack), or CSV exports.
Business Overview data is available through the Analytics Public API (use an organization-level S2S key).
What you can fetch
You can fetch data by widget; for that, you'll need the Widget ID and Dashboard ID.
For detailed information on endpoint and response structure, please check the Analytics API.
Send the key in the Authorization: Bearer … header. Dashboard widget periods are calculated in the dashboard time zone.
Where to find the ID
| Element | Where the ID is shown |
|---|---|
| Dashboard | Dashboard actions → Edit → Basic setup tab → field ID for API access (below the dashboard name) |
| Widget | Widget menu → Edit → field ID for API access (at the top of Widget details view) |
IDs are read-only. Click the field to copy.
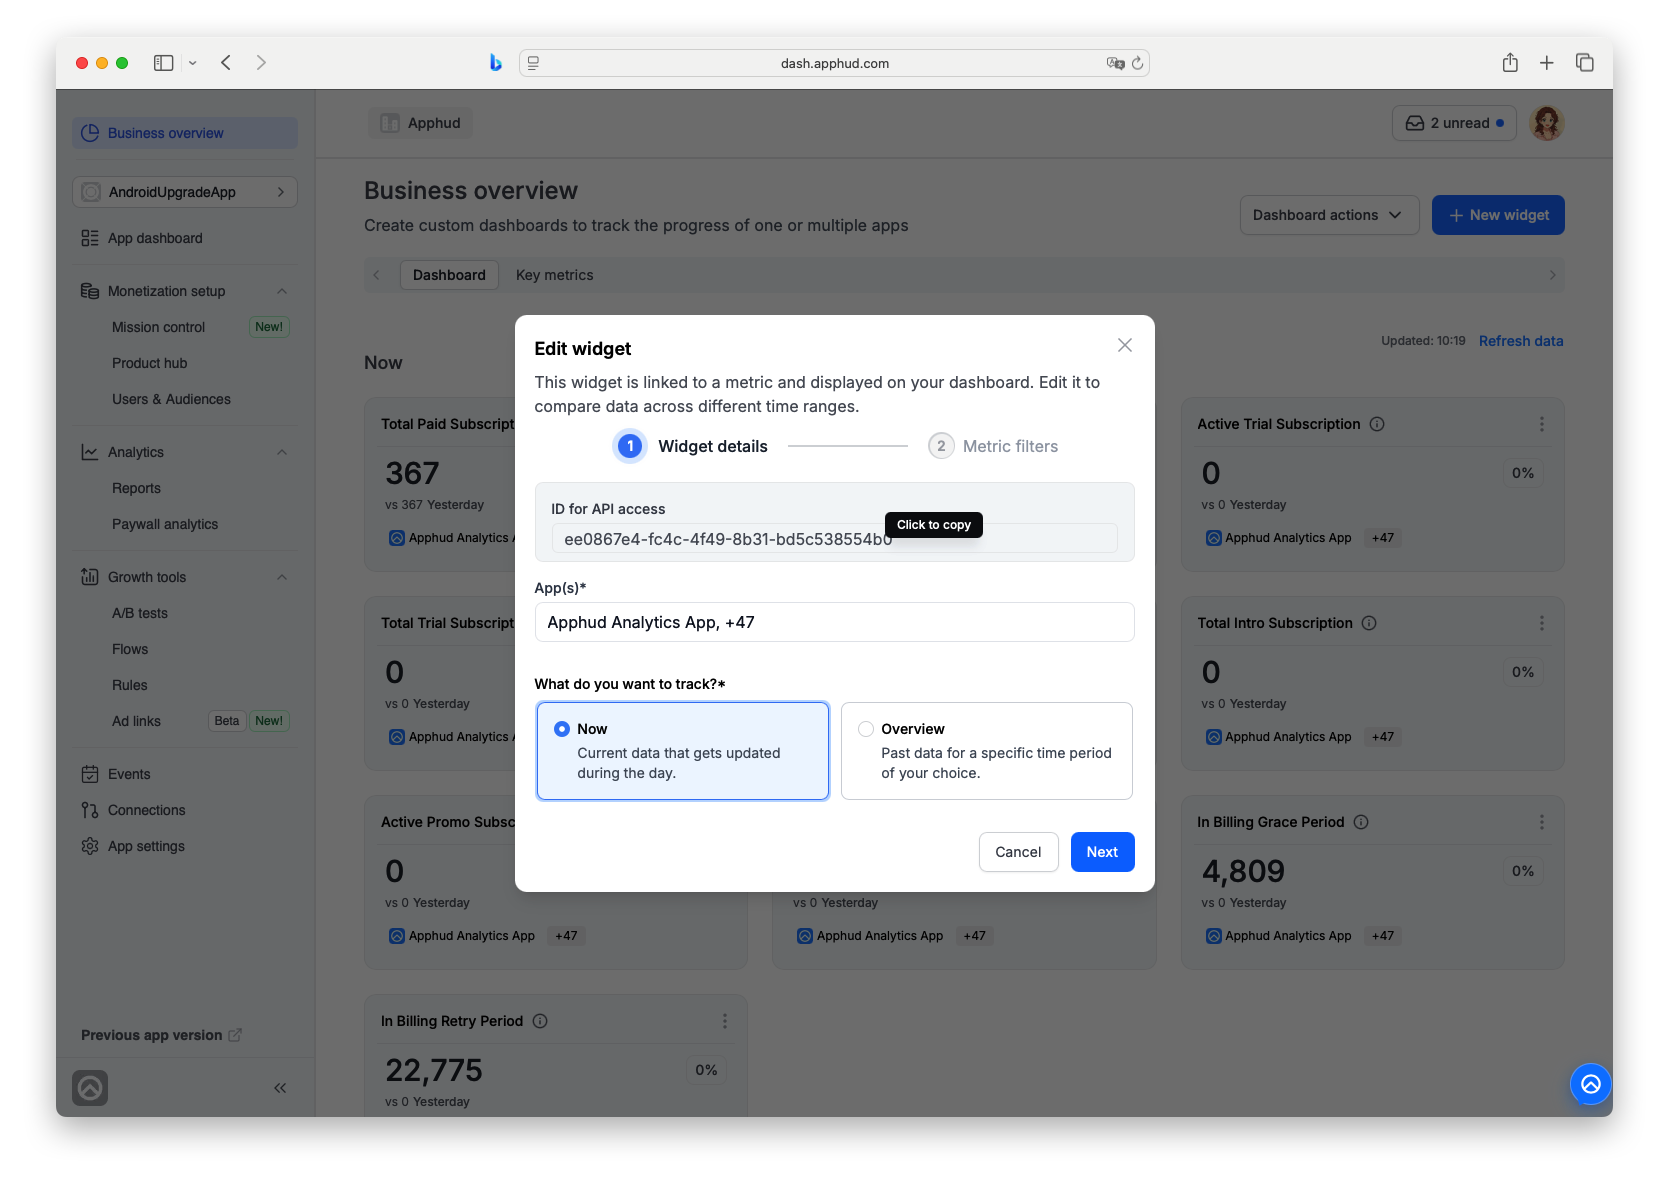
ID stability
- IDs are permanent and do not change when you rename or edit dashboards or widgets
- Duplicating creates a new ID
- Deleting invalidates the ID (API returns 404)
Mobile app
Business Overview is also available in the Apphud iOS app.
Company Owners and Admins can view dashboards on mobile and create iOS widgets for the phone screen based on a dashboard widget.
All modifications to the Business Overview dashboards can be done only in the web Apphud cabinet.
Once changes are made on the web, they'll be shown in the mobile app.
FAQ
Why do widgets show different periods?
The Overview section is probably in Per widget mode.
Select a global time range to see it for a unified period across widgets. If you'd like to make this a default behavior, each widget time period needs to be updated and saved.
How do I return to each widget's default period?
Open the date picker and click Per widget in the top-left corner.
Why do Now metrics not update automatically?
Now metrics show the state at the time the dashboard was loaded or refreshed. Click Refresh data to update them.
Why can historical metrics in the Overview section change over time?
Historical metrics may change because underlying data can be added or updated after the original event date.
This can happen when there was no proper migration of Historical data, and past transactions are received or reconstructed later, for example, from store receipts or server notifications, and when refund decisions are updated by the store.
In particular, refund-related metrics may change with a delay. For example, a refund request may initially be declined and later approved (including Win Back refund flows), which updates the corresponding metrics.
As a result, historical metrics are not strictly immutable and may change over time as new or updated data becomes available.
What affects how up-to-date analytics data is?
Analytics data depends on how quickly Apphud receives and processes events from stores and the app.
The most important factors are:
- Correct migration of existing apps — if the app was live before Apphud integration and no server-side migration was performed, historical data may appear later as receipts are received and processed
- Server notifications setup — App Store Server Notifications and Google Play Real-time Developer Notifications ensure that events like renewals, trial conversions, cancellations, and billing issues are delivered without delay
- Store-side processing delays — app stores may send some events (especially renewals or refunds) with a delay
If server notifications are not configured, some events may only be detected later during receipt validation, which delays their appearance in analytics.
Why can metrics definitions differ across platforms or when combining apps?
Apphud provides a unified analytics layer across iOS, Android, and Web, allowing you to track all apps in a single project or aggregate them in Business Overview.
However, some metrics and events are platform-specific.
For example:
- certain refund-related events (such as Refund requested or Refund declined) are available only for iOS
- some billing or lifecycle events may differ between App Store and Google Play
When aggregating data across apps and platforms:
- only apps that have the required data contribute to a metric
- platform-specific events will appear only where they are supported
This means that aggregated metrics may reflect differences in platform capabilities rather than inconsistencies in data.
Why does a new dashboard open with a custom period?
The period you pick on one dashboard is saved and applies to the others. Open the date picker and select Per widget to return to each widget's default period.
Why does a chart show No data found for a long period?
The selected period is longer than 31 days, and this metric's chart supports at most 31 days. Choose a shorter period, or select Per widget to return each widget to its own default period. The metrics that work for any period are listed in Dashboard timeline.
Updated 7 days ago