
Analytics API
Pull Apphud analytics — chart data and Business Overview widgets — into your own BI tools
Overview
The Analytics API returns the same numbers you see in Apphud's Reports and Dashboard, as JSON.
It is built for server-to-server (S2S) integrations: BI pipelines, data warehouses, scheduled
reports, internal dashboards and alerting. It is read-only — every endpoint is a query, nothing
in your account is ever modified.
- Base URL:
https://api.apphud.com/api/public/v1 - Format: JSON request and response bodies
- Auth:
Authorization: Bearer <api_key>
What you can query
| Surface in the dashboard | API endpoints | Key you need |
|---|---|---|
| Reports — per-app metrics with full segment and filter control | /chart/* | App-level S2S key |
| Dashboard — the single-number tiles for one app | /overview/widgets* | App-level S2S key |
Creating an API key
Apphud issues S2S keys at two levels. Pick the one that matches the scope of your integration.
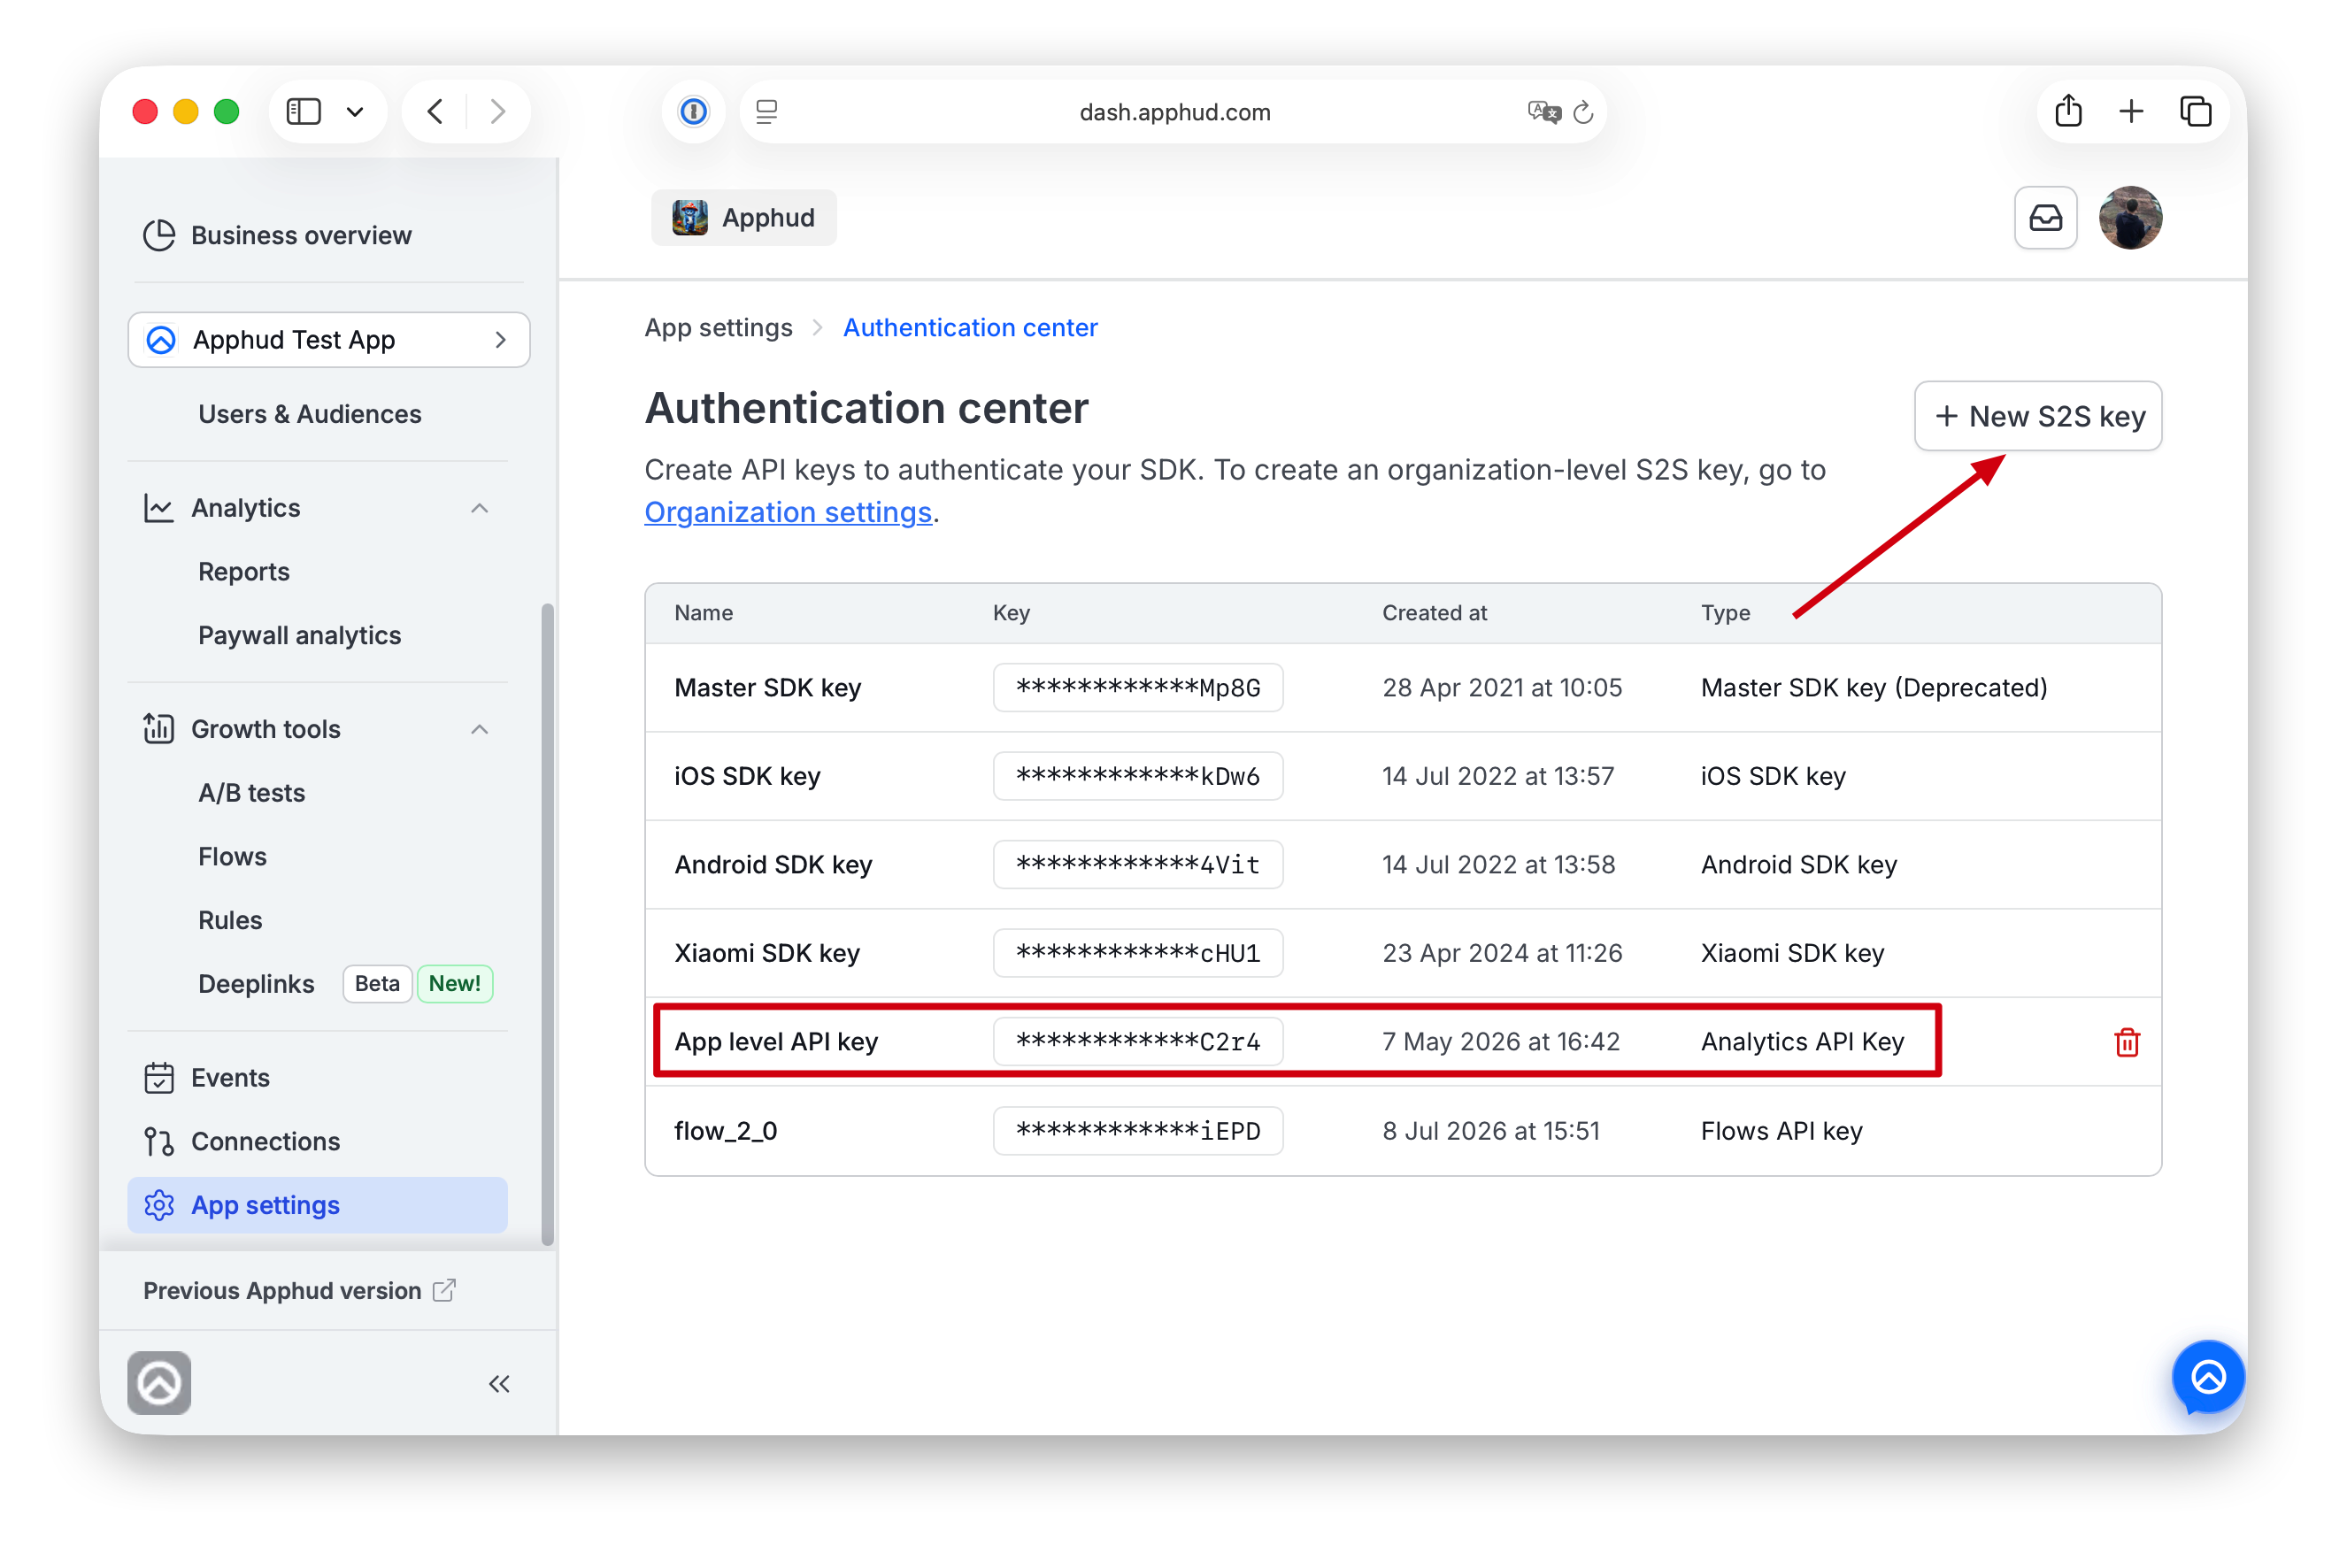
App-level key
Use this when your integration reads data for one application. This is the common case, and it
is enough for everything in this document.
Go to App settings → Authentication Center → New S2S Key.
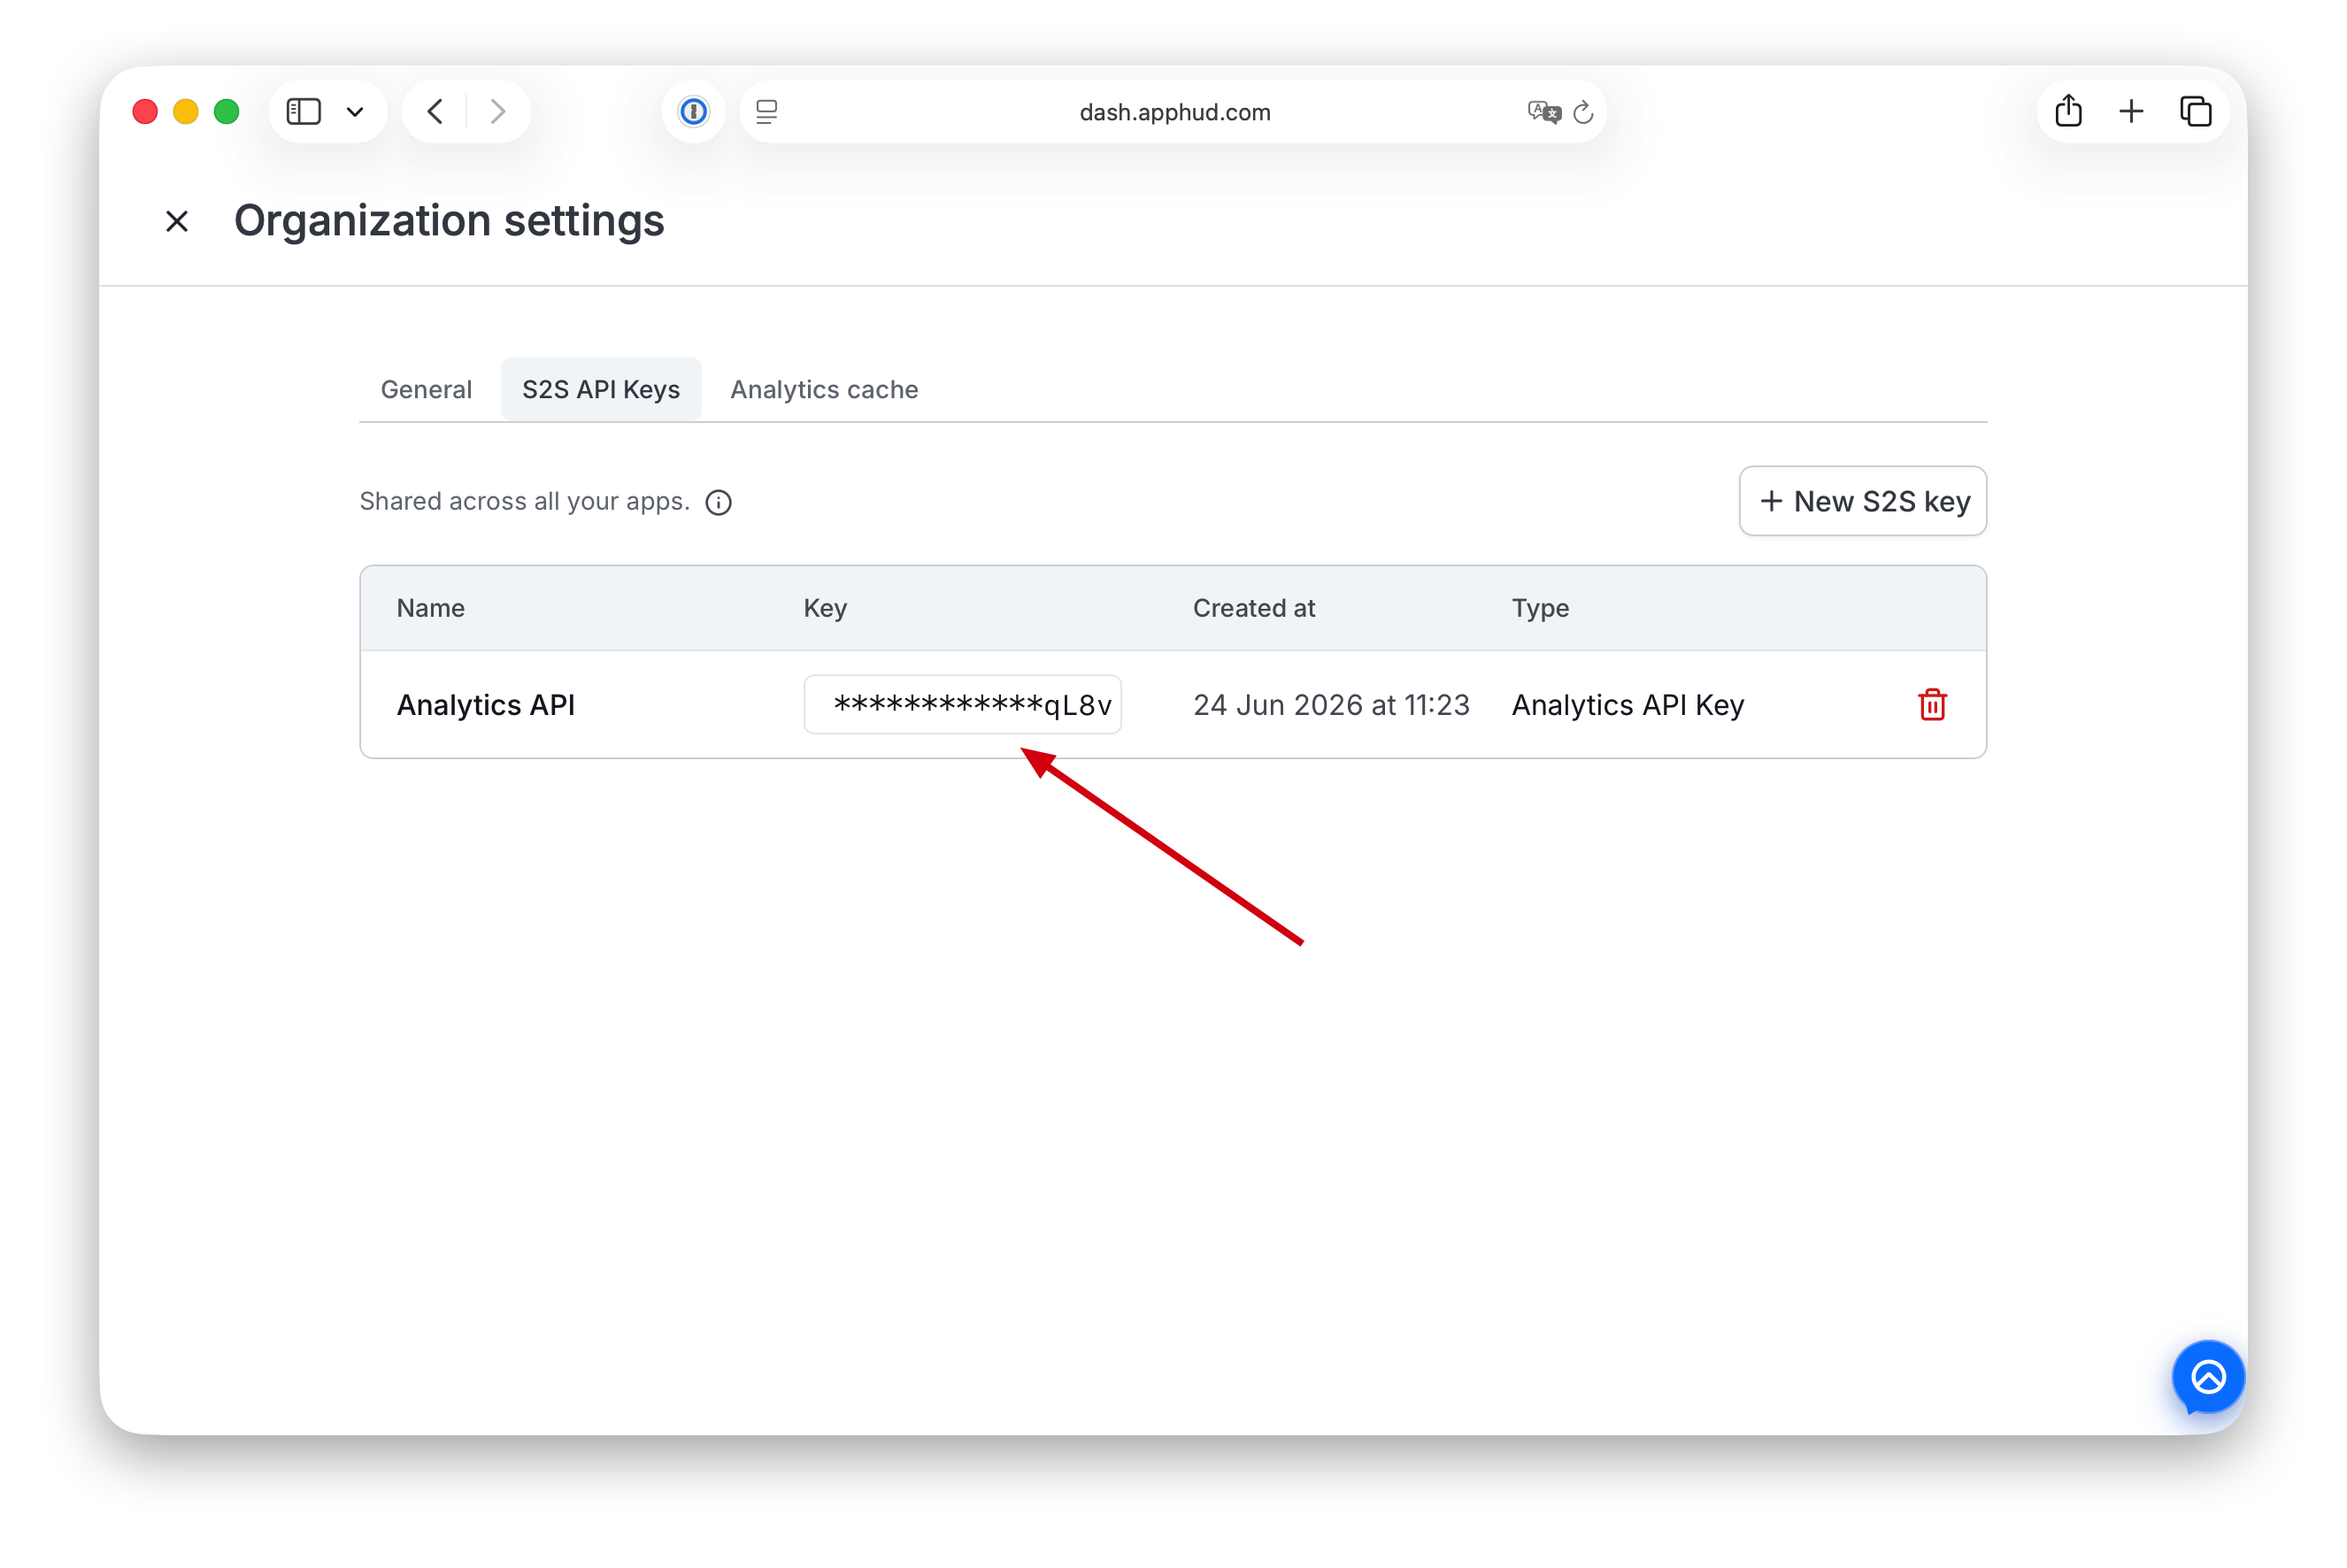
Organization-level key
An organization-level key has access to every application in the organization, so one key can
query several apps. Use it when a single pipeline pulls data for more than one app.
Go to Organization Settings and generate an API key there.
Using the key
Send the key on every request:
Authorization: Bearer sk_your_api_key_here- A missing, malformed or unknown key returns
401 unauthorized. - Requesting an
app_idthe key has no access to returns403 forbidden.
Request basics
app_id
app_idEvery chart and widget request takes an app_id — your Apphud application identifier, an
eight-character value such as 60b9058d. You can find it in App settings. It is not the bundle
identifier.
Response envelope
Every successful response uses the same wrapper. Your payload is under data.results. data.meta
carries presentation hints for the chart (axis label, tooltips) and is null when the endpoint
produces none.
{
  "data": {
    "results": { "...endpoint specific payload..." },
    "meta": null
  },
  "errors": null,
  "trace_id": "4bf92f3577b34da6a3ce929d0e0e4736"
}
Errors use the same wrapper with data: null:
{
  "data": null,
  "errors": [
    { "id": "missing_param", "title": "additional field: Required parameter is missing" }
  ],
  "trace_id": "4bf92f3577b34da6a3ce929d0e0e4736"
}
Always quote trace_id when you contact support — it identifies the exact request in our logs.
Time ranges
time_range.from and time_range.to are ISO-8601 timestamps. The UTC offset you send defines the
day boundaries used for grouping, so send the offset your reporting uses and keep it identical in
both fields. from must be strictly earlier than to.
"time_range": {
  "from": "2026-01-01T00:00:00.000+00:00",
  "to":   "2026-03-31T23:59:59.999+00:00"
}
Rate limits
- 60 requests per minute per API key. The limiter keys on the bearer token.
- Every response carries
X-RateLimit-Limit,X-RateLimit-RemainingandX-RateLimit-Reset. - Over the limit you get
429with a plain body — this one does not use the standard envelope:
{ "error": "rate_limit_exceeded", "message": "Too many requests. Limit: 60 requests per 1m0s" }Discovery calls (/chart/list, /chart/options) change rarely — cache them per deployment rather
than fetching them per query.
Errors
| Status | errors[].id | Typical cause |
|---|---|---|
| 400 | missing_param | A required field is absent, most often additional for a chart that requires it |
| 400 | invalid_input | Unknown chart_id, filter, segment or sorting field |
| 400 | invalid_time_range | from is not earlier than to |
| 400 | invalid_request | Malformed body, or a chart queried through the wrong endpoint |
| 400 | too_much_points | The range divided by view_by exceeds 190 points |
| 400 | too_much_segment | More than two segments requested |
| 401 | unauthorized | Missing, malformed or unknown API key |
| 403 | forbidden / no_access | The key has no access to this app, or the chart is not in your plan |
| 404 | not_found | Unknown widget |
| 408 | timeout | The query took too long — narrow the range or drop filters |
| 429 | — | Rate limit exceeded (see above) |
| 500 | internal_error | Server-side failure — retry, then contact support with the trace_id |
Reports
An app-level S2S key is enough for everything in this section.
Recommended call order
You never need to hardcode identifiers — discover them from the API itself:
GET  /chart/list      → pick a chart_id, read its type and additional[]
GET  /chart/options   → discover the segments and filters that chart supports
POST /chart/filter    → discover the possible values of one filter
POST /chart/query/line     (chart type "line")
POST /chart/query/column   (chart type "column", "stackedColumn" or "columnLine")
List charts — GET /chart/list
GET /chart/listReturns the catalog of charts available to the application, grouped the same way as the dashboard.
Start here: it gives you the chart_id, tells you which query endpoint to use, and lists every
calculation parameter the chart expects.
Query parameters: app_id (required).
curl -G https://api.apphud.com/api/public/v1/chart/list \
  -H "Authorization: Bearer $APPHUD_API_KEY" \
-d app_id=60b9058d{
"data": {
"results": {
"chart_groups": [
{
"name": "Money",
"charts": [
{
"id": "mrr",
"name": "Monthly Recurring Revenue",
"short_name": "MRR",
"description": "MRR represents recurring proceeds revenue normalized to a monthly amount…",
"doc_url": "https://docs.apphud.com/docs/mrr",
"type": "line",
"is_locked": false,
"additional": [
{
"id": "view_by",
"name": "View by",
"required": true,
"default_value": "86400",
"values": [
{ "id": "86400", "name": "Days" },
{ "id": "604800", "name": "Weeks" },
{ "id": "2592000", "name": "Months" }
]
}
]
}
]
}
]
},
"meta": null,
},
"errors": null,
"trace_id": "…"
}How to read it:
type: "line"→ query it withPOST /chart/query/line.
type: "column","stackedColumn"or"columnLine"→POST /chart/query/column.is_locked: true→ the chart exists but is not included in your plan; querying it returns403.additional[]is empty for charts that take no calculation options. When it is not empty, the
additionalobject is mandatory in the query request.
The additional field
additional fieldadditional carries the calculation options of a chart: time grouping, revenue basis, cohort
period and so on. It is a flat object of string keys and string values:
"additional": { "view_by": "86400" }Rules:
- Keys must come from that chart's
additional[].id. An unknown key returns
400 invalid additional key: <key>. - Values must come from that parameter's
values[].id. Anything else returns
400 invalid value <value> for key <key>. - Values are always strings —
"86400", never86400. - If the chart declares any parameter, omitting
additionalreturns
400 additional field: Required parameter is missing. The simplest correct request copies every
default_valuefrom/chart/list.
Parameters you will meet most often:
| Key | Meaning | Values |
|---|---|---|
view_by | Size of one data point, in seconds | "86400" (days), "604800" (weeks), "2592000" (months) |
view_by_cohort | Cohort bucket size for retention charts | "time_week", "time_month", "time_quarter", "time_year" |
calculate_using | Revenue basis | "proceeds", "sales" |
exclude_refunds | Refund handling | "with_refunds", "without_refunds" |
The authoritative per-chart list is always /chart/list.
view_byalso controls how many points a line chart returns. A request that would produce more
than 190 points is rejected — widenview_byor shorten the range.
Chart options — GET /chart/options
GET /chart/optionsReturns the segments and filters the chart supports for this application.
Query parameters: app_id, chart_id (both required).
curl -G https://api.apphud.com/api/public/v1/chart/options \
  -H "Authorization: Bearer $APPHUD_API_KEY" \
  -d app_id=60b9058d \
-d chart_id=proceeds{
"data": {
"results": {
"segment_groups": [
{
"label": "General",
"only_one": false,
"options": [
{ "value": "customer_country", "label": "Customer Country", "description": "" },
{ "value": "store_country", "label": "Store Country", "description": "" }
]
}
],
"filter_groups": [
{
"name": "General",
"filters": [
{
"id": "customer_country",
"name": "Customer Country",
"description": "",
"conditions": [
{ "value": "equals", "label": "= (is)", "symbol": "=" },
{ "value": "not_equals", "label": "≠ (is not)", "symbol": "≠" },
{ "value": "contains", "label": "∋ (contains)", "symbol": "∋" },
{ "value": "not_contains", "label": "∌ (does not contains)", "symbol": "∌" }
],
"values": []
}
]
}
],
"additional": {
"view_by": [
{ "value": "86400", "label": "Days" },
{ "value": "604800", "label": "Weeks" },
{ "value": "2592000", "label": "Months" }
]
}
},
"meta": null
},
"errors": null,
"trace_id": "…"
}Note the key names: segments use value / label, and segment groups use label / options. An
empty filters[].values means the values are not enumerable up front — fetch them with
/chart/filter.
Filter values — POST /chart/filter
POST /chart/filterReturns the values actually present in your data for one filter, narrowed by any filters you have
already applied.
| Field | Required | Description |
|---|---|---|
app_id | yes | Application identifier |
chart_id | yes | Chart identifier |
filter_id | yes | filter_groups[].filters[].id from /chart/options |
filters | no | Filters already applied, to narrow the result |
curl -X POST https://api.apphud.com/api/public/v1/chart/filter \
  -H "Authorization: Bearer $APPHUD_API_KEY" \
  -H "Content-Type: application/json" \
  -d '{
    "app_id":    "60b9058d",
    "chart_id":  "proceeds",
    "filter_id": "customer_country",
    "filters":   []
}'{
"data": {
"results": {
"id": "customer_country",
"values": [
{ "value": "US", "label": "United States" },
{ "value": "DE", "label": "Germany" }
],
"input_type": "text"
},
"meta": null
},
"errors": null,
"trace_id": "…"
}input_type is text or number and tells you how to render a free-form filter input.
For static filters such as Platform, Subscription Status, and Subscription Autorenewal, Apphud returns the predefined values directly. Platform values are always iOS, Android, and Web — including in advanced reports such as Renewals Performance and in chart aliases that expose the same platform filter.
Line chart — POST /chart/query/line
POST /chart/query/lineReturns a time series. Use it for charts whose type is line.
| Field | Required | Description |
|---|---|---|
app_id | yes | Application identifier |
chart_id | yes | Chart identifier whose type is line |
time_range | yes | { "from": ISO-8601, "to": ISO-8601 } |
additional | depends | Calculation options — mandatory when the chart declares any |
segments | no | Splits the result into one line per value. Only the first entry is used. Omit for a single aggregate line. |
filters | no | Narrows the data. Different filters are combined with AND. |
curl -X POST https://api.apphud.com/api/public/v1/chart/query/line \
  -H "Authorization: Bearer $APPHUD_API_KEY" \
  -H "Content-Type: application/json" \
  -d '{
    "app_id":   "60b9058d",
    "chart_id": "proceeds",
    "time_range": {
      "from": "2026-01-01T00:00:00.000+00:00",
      "to":   "2026-03-31T23:59:59.999+00:00"
    },
    "additional": { "view_by": "86400" },
    "segments": [ { "id": "customer_country" } ],
    "filters": [
      {
        "id": "customer_country",
        "values": [ { "condition": "equals", "value": "US" } ]
      }
    ]
  }'
Filter shape
{
  "id": "customer_country",
  "condition": "equals",
  "values": [
    { "condition": "equals", "value": "US" },
    { "condition": "equals", "value": "CA" }
  ]
}| Field | Required | Description |
|---|---|---|
id | yes | Filter id from /chart/options |
values[].condition | yes | equals, not_equals, contains or not_contains — must be one of that filter's conditions[].value |
values[].value | yes | Value to compare against, from /chart/filter |
condition | no | Filter-level condition controlling how several values combine |
Several values inside one filter combine with OR by default, so the example above means
"US or CA". For a negative filter, repeat the condition at the filter level
("condition": "not_equals") and the values combine with AND instead — "neither US nor CA".
Response
{
  "data": {
    "results": {
      "lines": [
        {
          "name": "United States",
          "cnt": 1523,
          "points": [
            {
              "point": "2026-01-01T00:00:00Z",
              "is_predict": 0,
              "values": [ { "name": "Proceeds", "type": "money", "value": 15234.56 } ]
            }
          ]
        }
      ]
    },
    "meta": { "axis_x": "Date" }
  },
  "errors": null,
  "trace_id": "…"
}nameis the segment value of the line, or"(none)"when no segment was requested.points[].pointis the start of the bucket; bucket width isadditional.view_by.values[].typeismoney,percentorsimple.is_predict: 1marks a projected point (LTV / CLV forecasts).cntis the number of underlying entities in that line.
A range with no data returns 200 with lines: [], not a 404.
Column chart — POST /chart/query/column
POST /chart/query/columnReturns rows instead of a time series. Use it for charts whose type is column,
stackedColumn or columnLine.
Same fields as the line chart, plus:
| Field | Required | Description |
|---|---|---|
segments | no | Each segment adds a column to every row; two is the maximum. When omitted, the chart's first available segment is used. |
pagination.limit | no | Rows per page, maximum 2000 |
pagination.offset | no | Rows to skip |
sorting.field | no | "Segment" or one of the chart's value names, e.g. "Proceeds" |
sorting.order | no | "ASC" or "DESC" — uppercase |
curl -X POST https://api.apphud.com/api/public/v1/chart/query/column \
  -H "Authorization: Bearer $APPHUD_API_KEY" \
  -H "Content-Type: application/json" \
  -d '{
    "app_id":   "60b9058d",
    "chart_id": "renewals_performance",
    "time_range": {
      "from": "2026-01-01T00:00:00.000+00:00",
      "to":   "2026-03-31T23:59:59.999+00:00"
    },
    "segments":   [ { "id": "customer_country" } ],
    "filters":    [],
    "additional": {},
    "pagination": { "offset": 0, "limit": 100 },
    "sorting":    { "field": "Segment", "order": "DESC" }
}'{
"data": {
"results": {
"rows": [
{
"segments": [ { "name": "customer_country", "value": "United States", "in_progress": false } ],
"values": [ { "name": "Renewals", "type": "simple", "value": 1523 } ]
}
]
},
"meta": null
},
"errors": null,
"trace_id": "…"
}in_progress: true marks a bucket whose period has not finished yet, so its value may still change.
The response contains rows only — there is no total count. Page until you receive fewer rows than
your limit.
App dashboard
These endpoints return the single-number tiles of an app's Dashboard. An app-level S2S key is
enough; the widget is always calculated for the one app_id you pass.
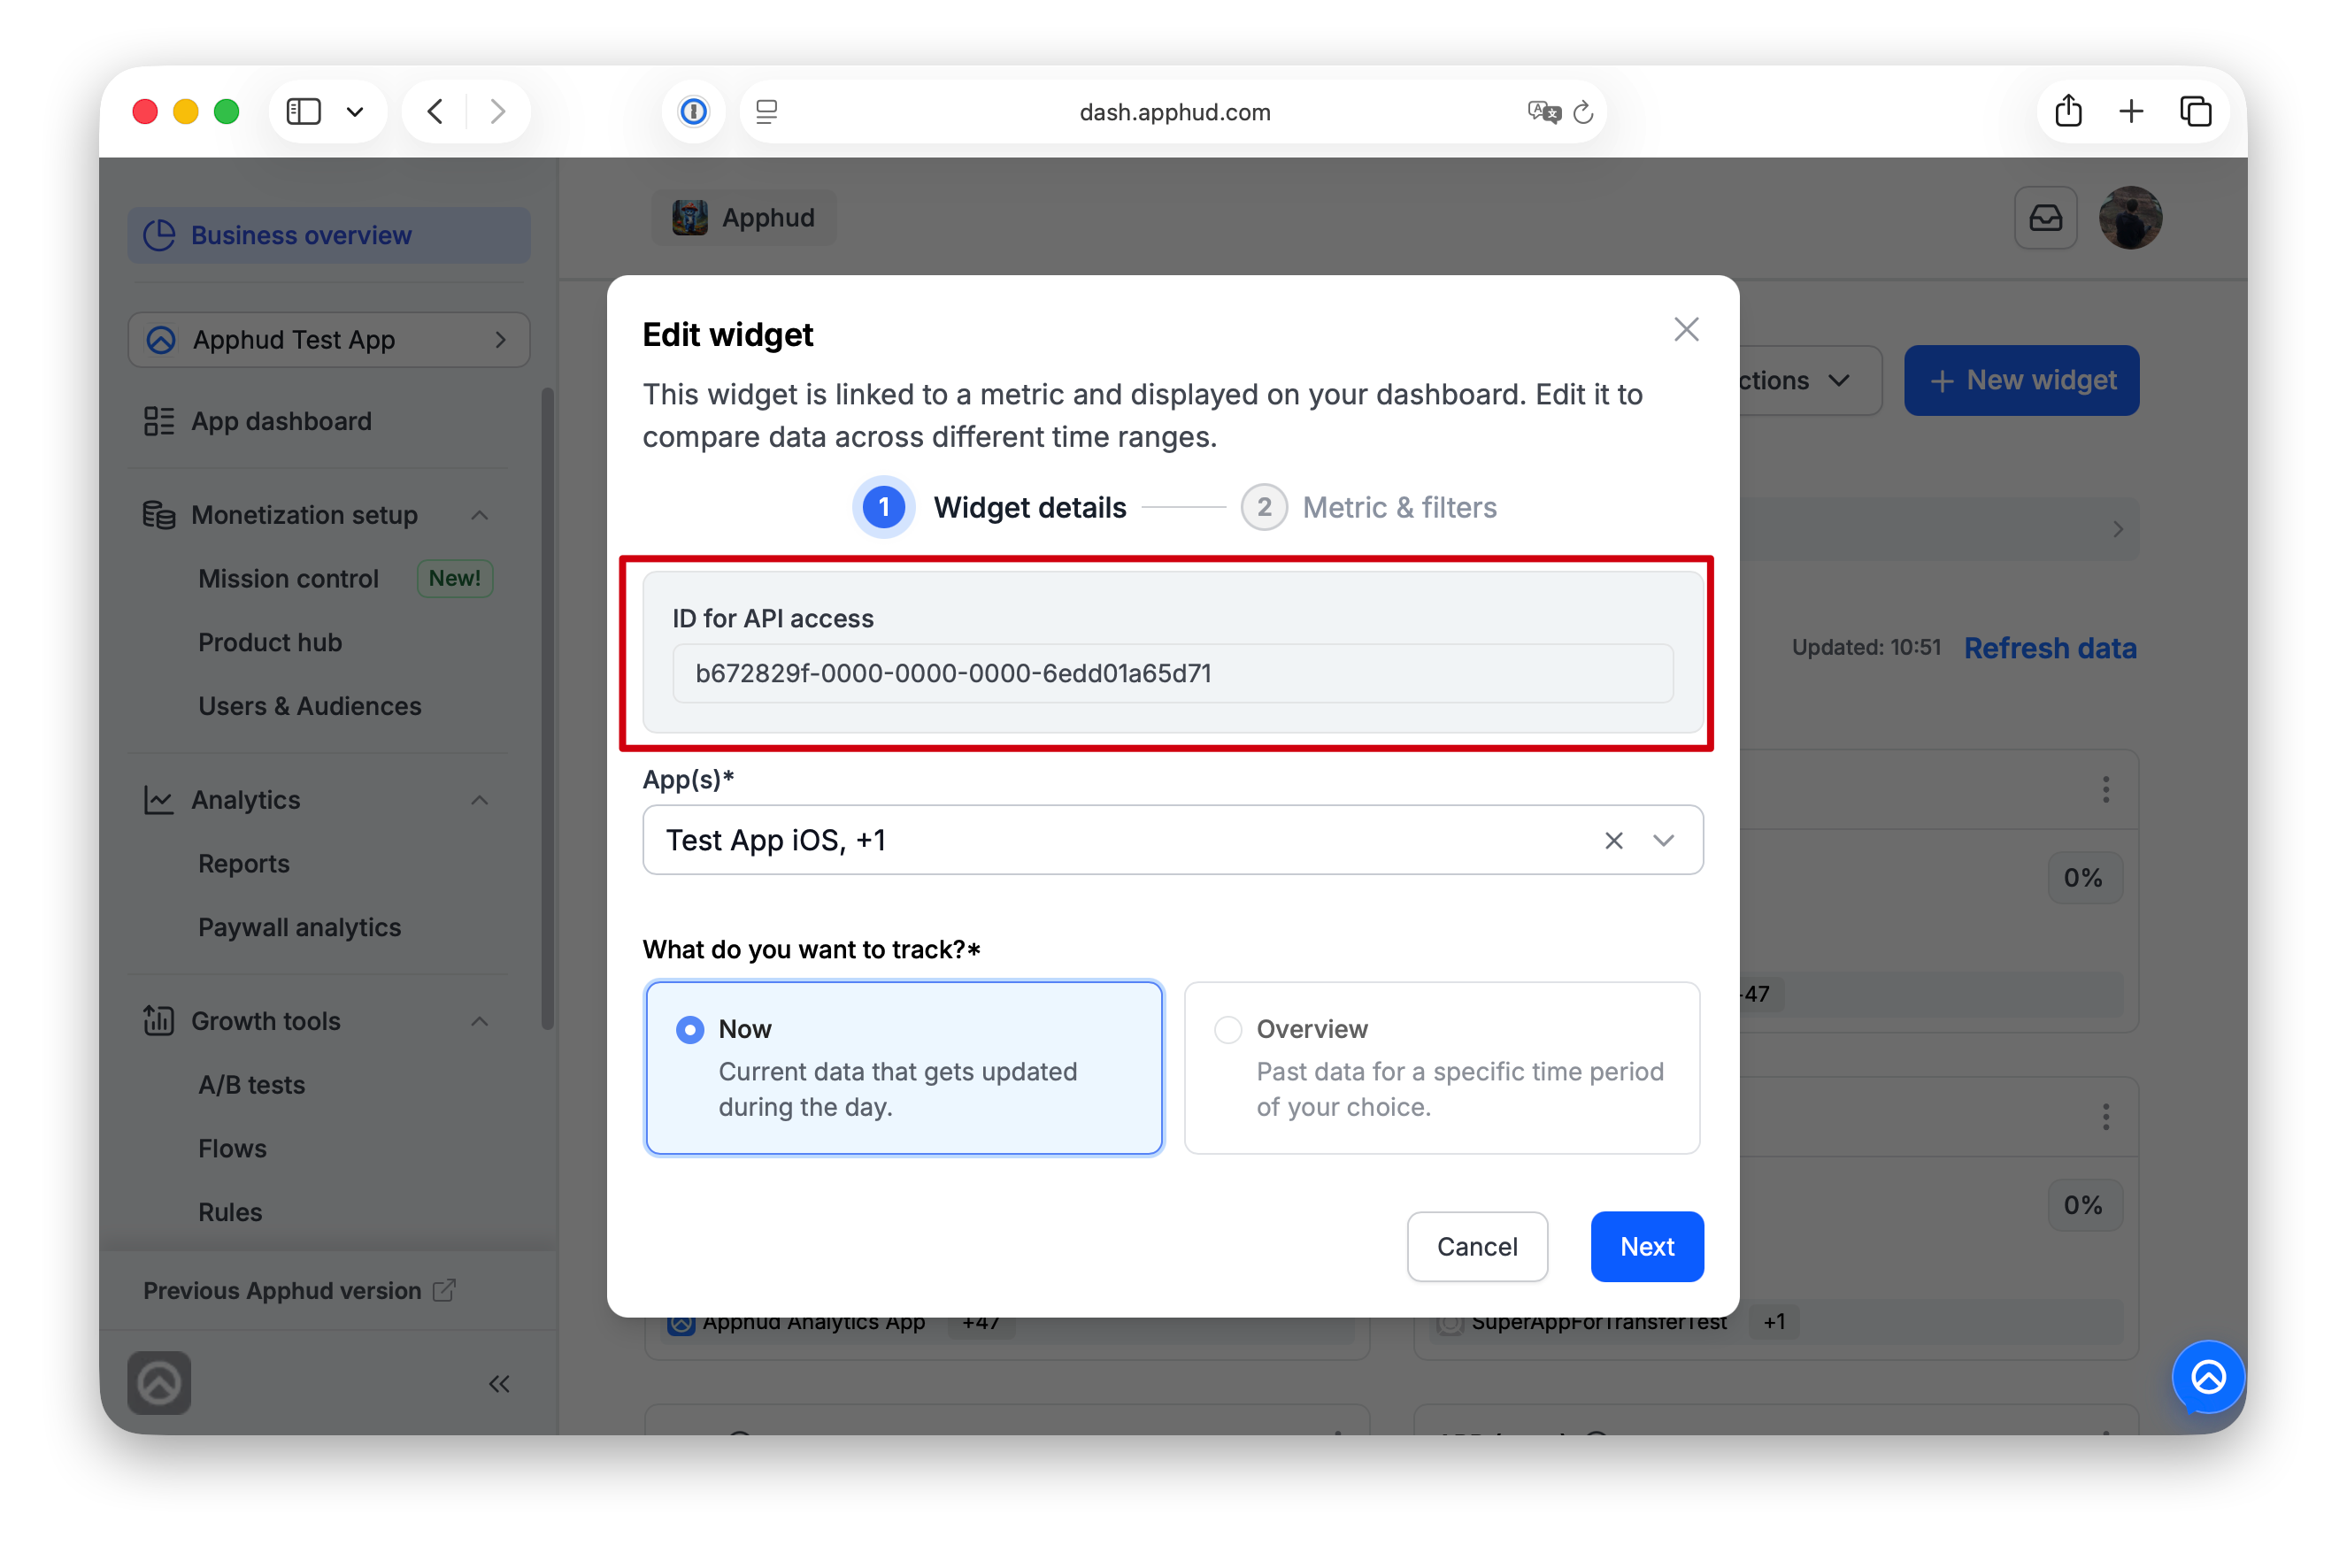
List widgets (optional) — GET /overview/widgets
GET /overview/widgetsReturns the full widget catalog, split into now (current state) and overview (a period). Take
the id — a UUID — from either list and use it as {widgetId}.
curl https://api.apphud.com/api/public/v1/overview/widgets \
-H "Authorization: Bearer $APPHUD_API_KEY"{
"data": {
"results": {
"now": [
{
"id": "01234567-89ab-cdef-0123-456789abcde1",
"name": "MRR",
"metrics": "mrr",
"type": "now",
"chart_id": "mrr",
"description": "MRR (Monthly Recurring Revenue) represents recurring proceeds revenue…",
"delta": 30,
"position": 0
}
],
"overview": [
{
"id": "01234567-89ab-cdef-0123-456789abcdeb",
"name": "Proceeds",
"metrics": "proceeds",
"type": "overview",
"chart_id": "proceeds",
"description": "An estimated revenue developer receives after deducting store commissions, refunds and VAT.",
"time_ago": "last_90_days",
"position": 10
}
]
},
"meta": null
},
"errors": null,
"trace_id": "…"
}
Available widgets:
| Type | metrics | Widget |
|---|---|---|
| now | mrr | MRR |
| now | arr | ARR |
| now | active_paid_subs | Active paid subscriptions |
| now | active_trial_subs | Active trial subscriptions |
| now | active_intro_subs | Active intro subscriptions |
| now | active_promo_subs | Active promo subscriptions |
| now | in_billing_grace_period | In billing grace period |
| now | in_billing_retry_period | In billing retry period |
| overview | gross_revenue | Gross revenue |
| overview | sales | Sales |
| overview | proceeds | Proceeds |
| overview | refunds | Refunds |
| overview | refund_rate | Refund rate |
| overview | billing_issue | Billing issues |
| overview | arpu | ARPU |
| overview | arppu | ARPPU |
| overview | prevented_refund_requests | Prevented refund requests |
| overview | subscriptions_started | Subscriptions started |
| overview | trials_started | Trials started |
| overview | trials_canceled | Trials canceled |
| overview | trials_converted | Trials converted |
| overview | intro_subs_started | Intro subs started |
| overview | promo_subs_started | Promo subs started |
| overview | non_renewing_purchases | Non-renewing purchases |
| overview | new_users | New users |
Query a widget — POST /overview/widgets/{widgetId}/query
POST /overview/widgets/{widgetId}/query| Field | Required | Description |
|---|---|---|
app_id | yes | Application identifier |
time_ago | no | Relative period preset |
time_range | no | Explicit from / to, both with the same UTC offset |
filters | no | Same filter shape as chart queries |
force | no | true bypasses the cache — slower, use sparingly |
time_ago accepts today, yesterday, last_7_days, last_30_days, last_90_days,
this_month, last_month, this_year, last_year. When you send neither time_ago nor
time_range, the widget falls back to last_90_days. All time operations here use UTC.
curl -X POST https://api.apphud.com/api/public/v1/overview/widgets/01234567-89ab-cdef-0123-456789abcdeb/query \
  -H "Authorization: Bearer $APPHUD_API_KEY" \
  -H "Content-Type: application/json" \
  -d '{
    "app_id":   "60b9058d",
    "time_ago": "last_30_days",
    "filters":  []
}'{
"data": {
"results": {
"value": 48213.44,
"value_overview": 41902.10,
"percent_overview": 15.06,
"type": "money",
"comparison_time_range": { "from": "2026-05-01T00:00:00Z", "to": "2026-05-31T23:59:59Z" },
"last_data_update": "2026-06-30T09:41:12Z",
"from_cache": true
},
"meta": null
},
"errors": null,
"trace_id": "…"
}valueis the widget's number for the requested period.value_overviewis the same metric over the comparison period, andpercent_overviewis the
change between them.comparison_time_rangetells you exactly which period was compared.typeismoney,percent,intorfloat.from_cacheshows whether the answer came from the cache;last_data_updateis when it was
computed. Widget results are cached for one hour.
Widget filter values — POST /overview/widgets/filters
POST /overview/widgets/filterscurl -X POST https://api.apphud.com/api/public/v1/overview/widgets/filters \
-H "Authorization: Bearer $APPHUD_API_KEY" \
-H "Content-Type: application/json" \
-d '{
"app_id": "60b9058d",
"widget_metrics": "proceeds",
"filter_id": "customer_country",
"filters": []
}'widget_metrics is the metrics field of the widget from GET /overview/widgets. The response has
the same shape as POST /chart/filter.
Invalidate cache — DELETE /cache
DELETE /cacheDrops cached chart and widget data for every application reachable by your API key. Use it after
a data backfill or a batch of late-processed refunds; it is not needed in normal operation. The next
queries for those apps are recomputed from the warehouse, so they are slower until the cache warms
up again.
curl -X DELETE https://api.apphud.com/api/public/v1/cache \
-H "Authorization: Bearer $APPHUD_API_KEY"{
"data": { "results": { "invalidated_apps": 3 }, "meta": null },
"errors": null,
"trace_id": "…"
}End-to-end example
Proceeds for Q1 2026, grouped by week, split by country, US and Canada only.
API=https://api.apphud.com/api/public/v1
AUTH="Authorization: Bearer $APPHUD_API_KEY"
APP=60b9058d

# 1. Find the chart and its calculation options.
curl -sG "$API/chart/list" -H "$AUTH" -d app_id=$APP \
  | jq '.data.results.chart_groups[].charts[] | select(.id=="proceeds")'
# -> type "line", additional: view_by (required, default "86400")

# 2. Find a segment to split by.
curl -sG "$API/chart/options" -H "$AUTH" -d app_id=$APP -d chart_id=proceeds \
  | jq '.data.results.segment_groups[].options[].value'
# -> "customer_country", "store_country", …

# 3. Find the values of the filter we want.
curl -s -X POST "$API/chart/filter" -H "$AUTH" -H "Content-Type: application/json" \
  -d "{\"app_id\":\"$APP\",\"chart_id\":\"proceeds\",\"filter_id\":\"customer_country\",\"filters\":[]}" \
  | jq '.data.results.values[].value'
# -> "US", "CA", "DE", …

# 4. Run the query.
curl -s -X POST "$API/chart/query/line" -H "$AUTH" -H "Content-Type: application/json" -d '{
  "app_id":   "'$APP'",
  "chart_id": "proceeds",
  "time_range": { "from": "2026-01-01T00:00:00.000+00:00", "to": "2026-03-31T23:59:59.999+00:00" },
  "additional": { "view_by": "604800" },
  "segments": [ { "id": "customer_country" } ],
  "filters": [
    { "id": "customer_country",
      "values": [ { "condition": "equals", "value": "US" },
                  { "condition": "equals", "value": "CA" } ] }
  ]
}' | jq '.data.results.lines[] | {name, points: (.points | length)}'
Daily proceeds snapshot for a scheduled job:
curl -s -X POST https://api.apphud.com/api/public/v1/overview/widgets/01234567-89ab-cdef-0123-456789abcdeb/query \
  -H "Authorization: Bearer $APPHUD_API_KEY" -H "Content-Type: application/json" \
  -d '{ "app_id": "60b9058d", "time_ago": "yesterday" }' \
  | jq '.data.results.value'
Data rules
The same rules that govern the dashboard apply to API responses:
- Production only. Sandbox, TestFlight and staging data never appear in API responses.
- Currency. Money metrics are returned in USD, converted at event time and frozen.
- VAT and store commission. Proceeds are net of refunds, store commission and VAT.
- Freshness. Same near-real-time windows as the dashboard — most charts within an hour, revenue
charts within 15 minutes, predictions refreshed daily. - History can change. Proceeds and refund metrics shift retroactively when stores process
refunds late. Re-query the period you need rather than treating a past export as immutable. - Cohorts. For cohort metrics, exclude users whose First Seen Date is today — the API does not
exclude them for you. - Don't hardcode identifiers. Chart, segment and filter ids are stable but not contractual.
Reading them from/chart/listand/chart/optionskeeps your integration working across
dashboard updates.
Interactive reference
The full request and response schema is available as Swagger:
https://api.apphud.com/api/public/v1/swagger/index.html
Use it for field-by-field schemas and try-it-out testing during development. This page covers the
conceptual model, data rules and common usage patterns.
Business Overview
Business Overview dashboards are the company-level, multi-app dashboards you build in the UI (as opposed to the single-app tiles in App dashboard above). They are available through the public API with an organization-level S2S key, keyed on company_id.
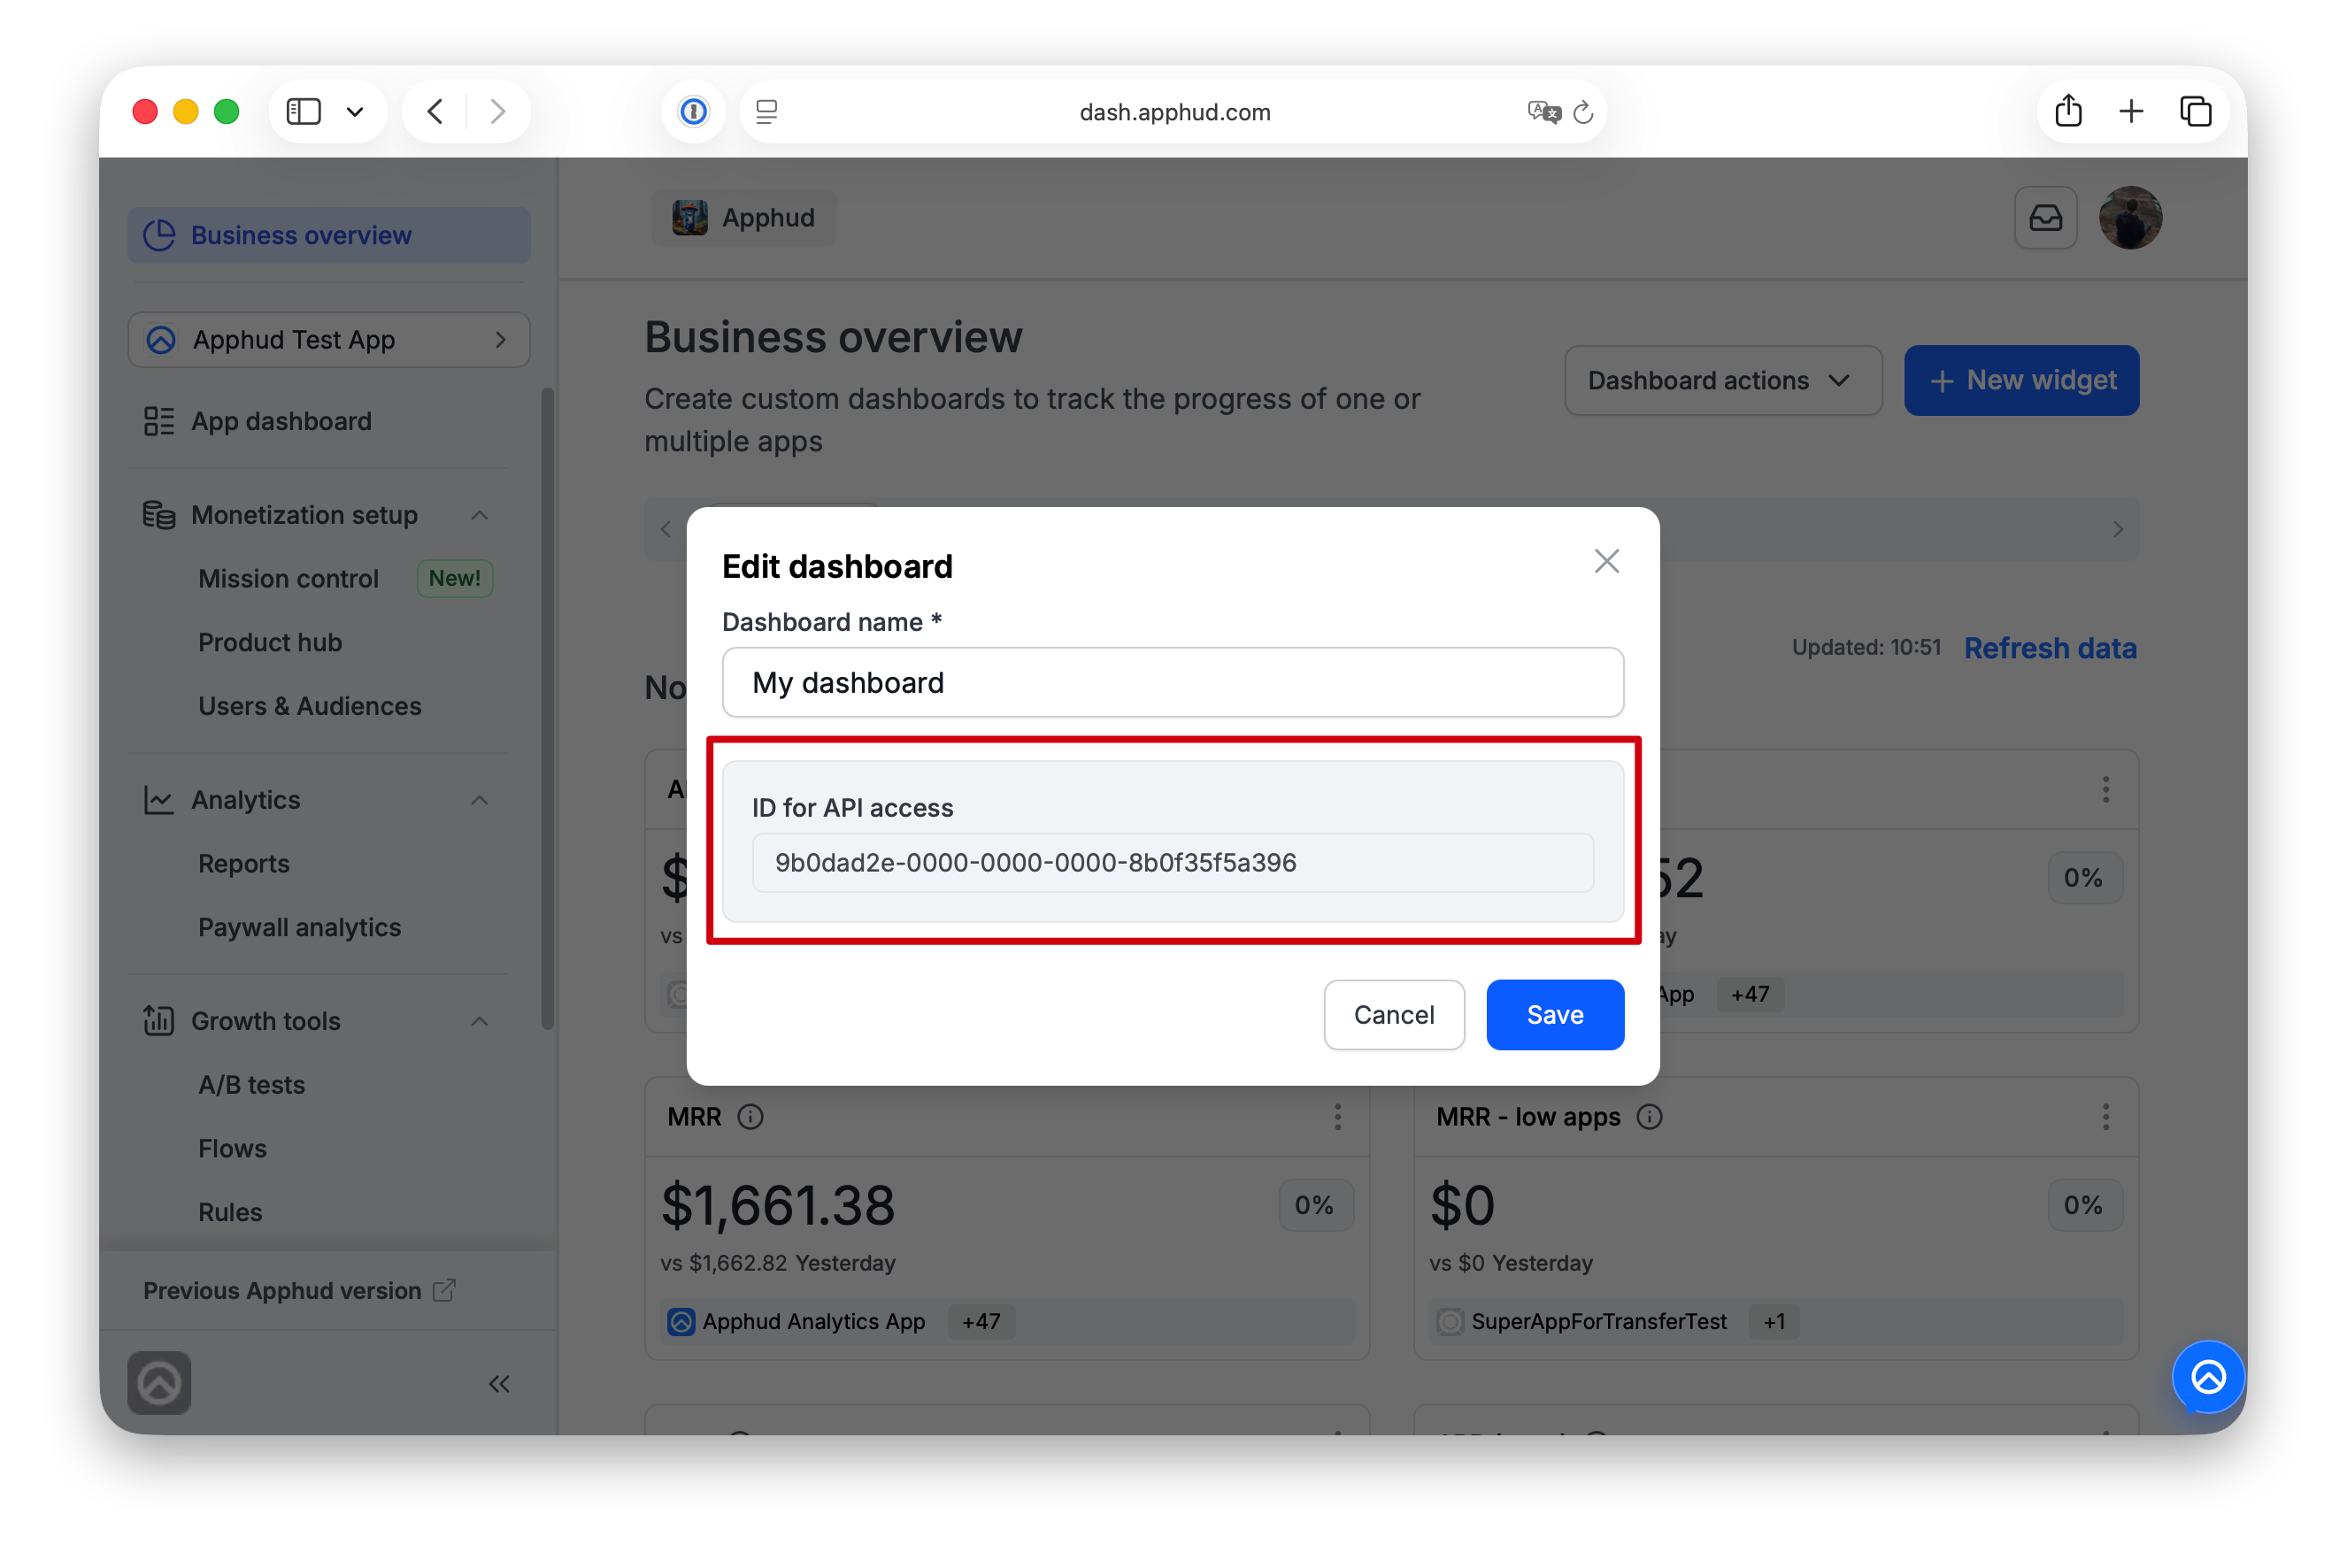
Take the Dashboard ID and Widget ID from the UI — Dashboard actions → Rename → ID for API access, and Widget menu → Edit → ID for API access — or from the list responses below.
List dashboards — GET /dashboards
GET /dashboardsReturns the dashboards for a company: their IDs, names, time zones, and creation timestamps.
curl -G https://api.apphud.com/api/public/v1/dashboards \
  -H "Authorization: Bearer $APPHUD_API_KEY" \
  -d company_id=380d4f63
company_id is your Apphud company identifier.
List dashboard widgets — GET /dashboards/{dashboardId}/widgets
GET /dashboards/{dashboardId}/widgetsReturns the widgets on a dashboard, split into now and overview. Each widget includes its id, dashboard_id, metric, selected apps, and saved filters / time settings.
curl https://api.apphud.com/api/public/v1/dashboards/9b0dad2e-365b-4eca-8a2f-8b0f35f5a396/widgets \
  -H "Authorization: Bearer $APPHUD_API_KEY"
Query a dashboard widget — POST /dashboards/{dashboardId}/widgets/{widgetId}/query
POST /dashboards/{dashboardId}/widgets/{widgetId}/querycurl -X POST https://api.apphud.com/api/public/v1/dashboards/9b0dad2e-365b-4eca-8a2f-8b0f35f5a396/widgets/01234567-89ab-cdef-0123-456789abcdeb/query \
-H "Authorization: Bearer $APPHUD_API_KEY" \
-H "Content-Type: application/json" \
-d '{
"time_ago": "last_30_days",
"filters": [],
"force": false
}'No app_id in the body — the widget already knows which apps it covers. time_ago and time_range are mutually exclusive; if both are omitted, the widget's saved range is used. Business Overview widget dates are calculated in the dashboard time zone, not UTC.
Dashboard widget filter values — POST /dashboards/widget-filters
POST /dashboards/widget-filterscurl -X POST https://api.apphud.com/api/public/v1/dashboards/widget-filters \
-H "Authorization: Bearer $APPHUD_API_KEY" \
-H "Content-Type: application/json" \
-d '{
"company_id": "380d4f63",
"widget_metrics": "proceeds",
"filter_id": "customer_country",
"apps": ["60b9058d"],
"filters": []
}'Returns values in the same shape as POST /chart/filter.
Updated about 2 months ago