
A/B Tests Overview
Run A/B tests on paywalls and App remote config to find the best-performing variation. Tests inherit a Targeting's audience and platforms; you choose what to vary.
A/B tests let you compare variations of paywalls and App remote config against a Control and measure which performs best. Every A/B test runs on top of an existing Targeting — the test inherits that targeting's audience filters and platforms. You only choose which of its assets to vary.
Find A/B tests in the left sidebar under Growth tools → A/B tests.
How a test works
- Pick an existing Targeting to define the audience and platforms.
- Pick assets to vary — placements (with their paywalls) and/or App remote config.
- Define variations — each variation gets its own paywall per a tested placement and/or its own app remote config JSON. The Control variation always serves what the Targeting already serves.
- Allocate audience size (share of matching users entered into the test) and variation weights (how those users split across variations).
- Launch.
Paywalls used as variations are frozen at launch — see Paywall snapshots.
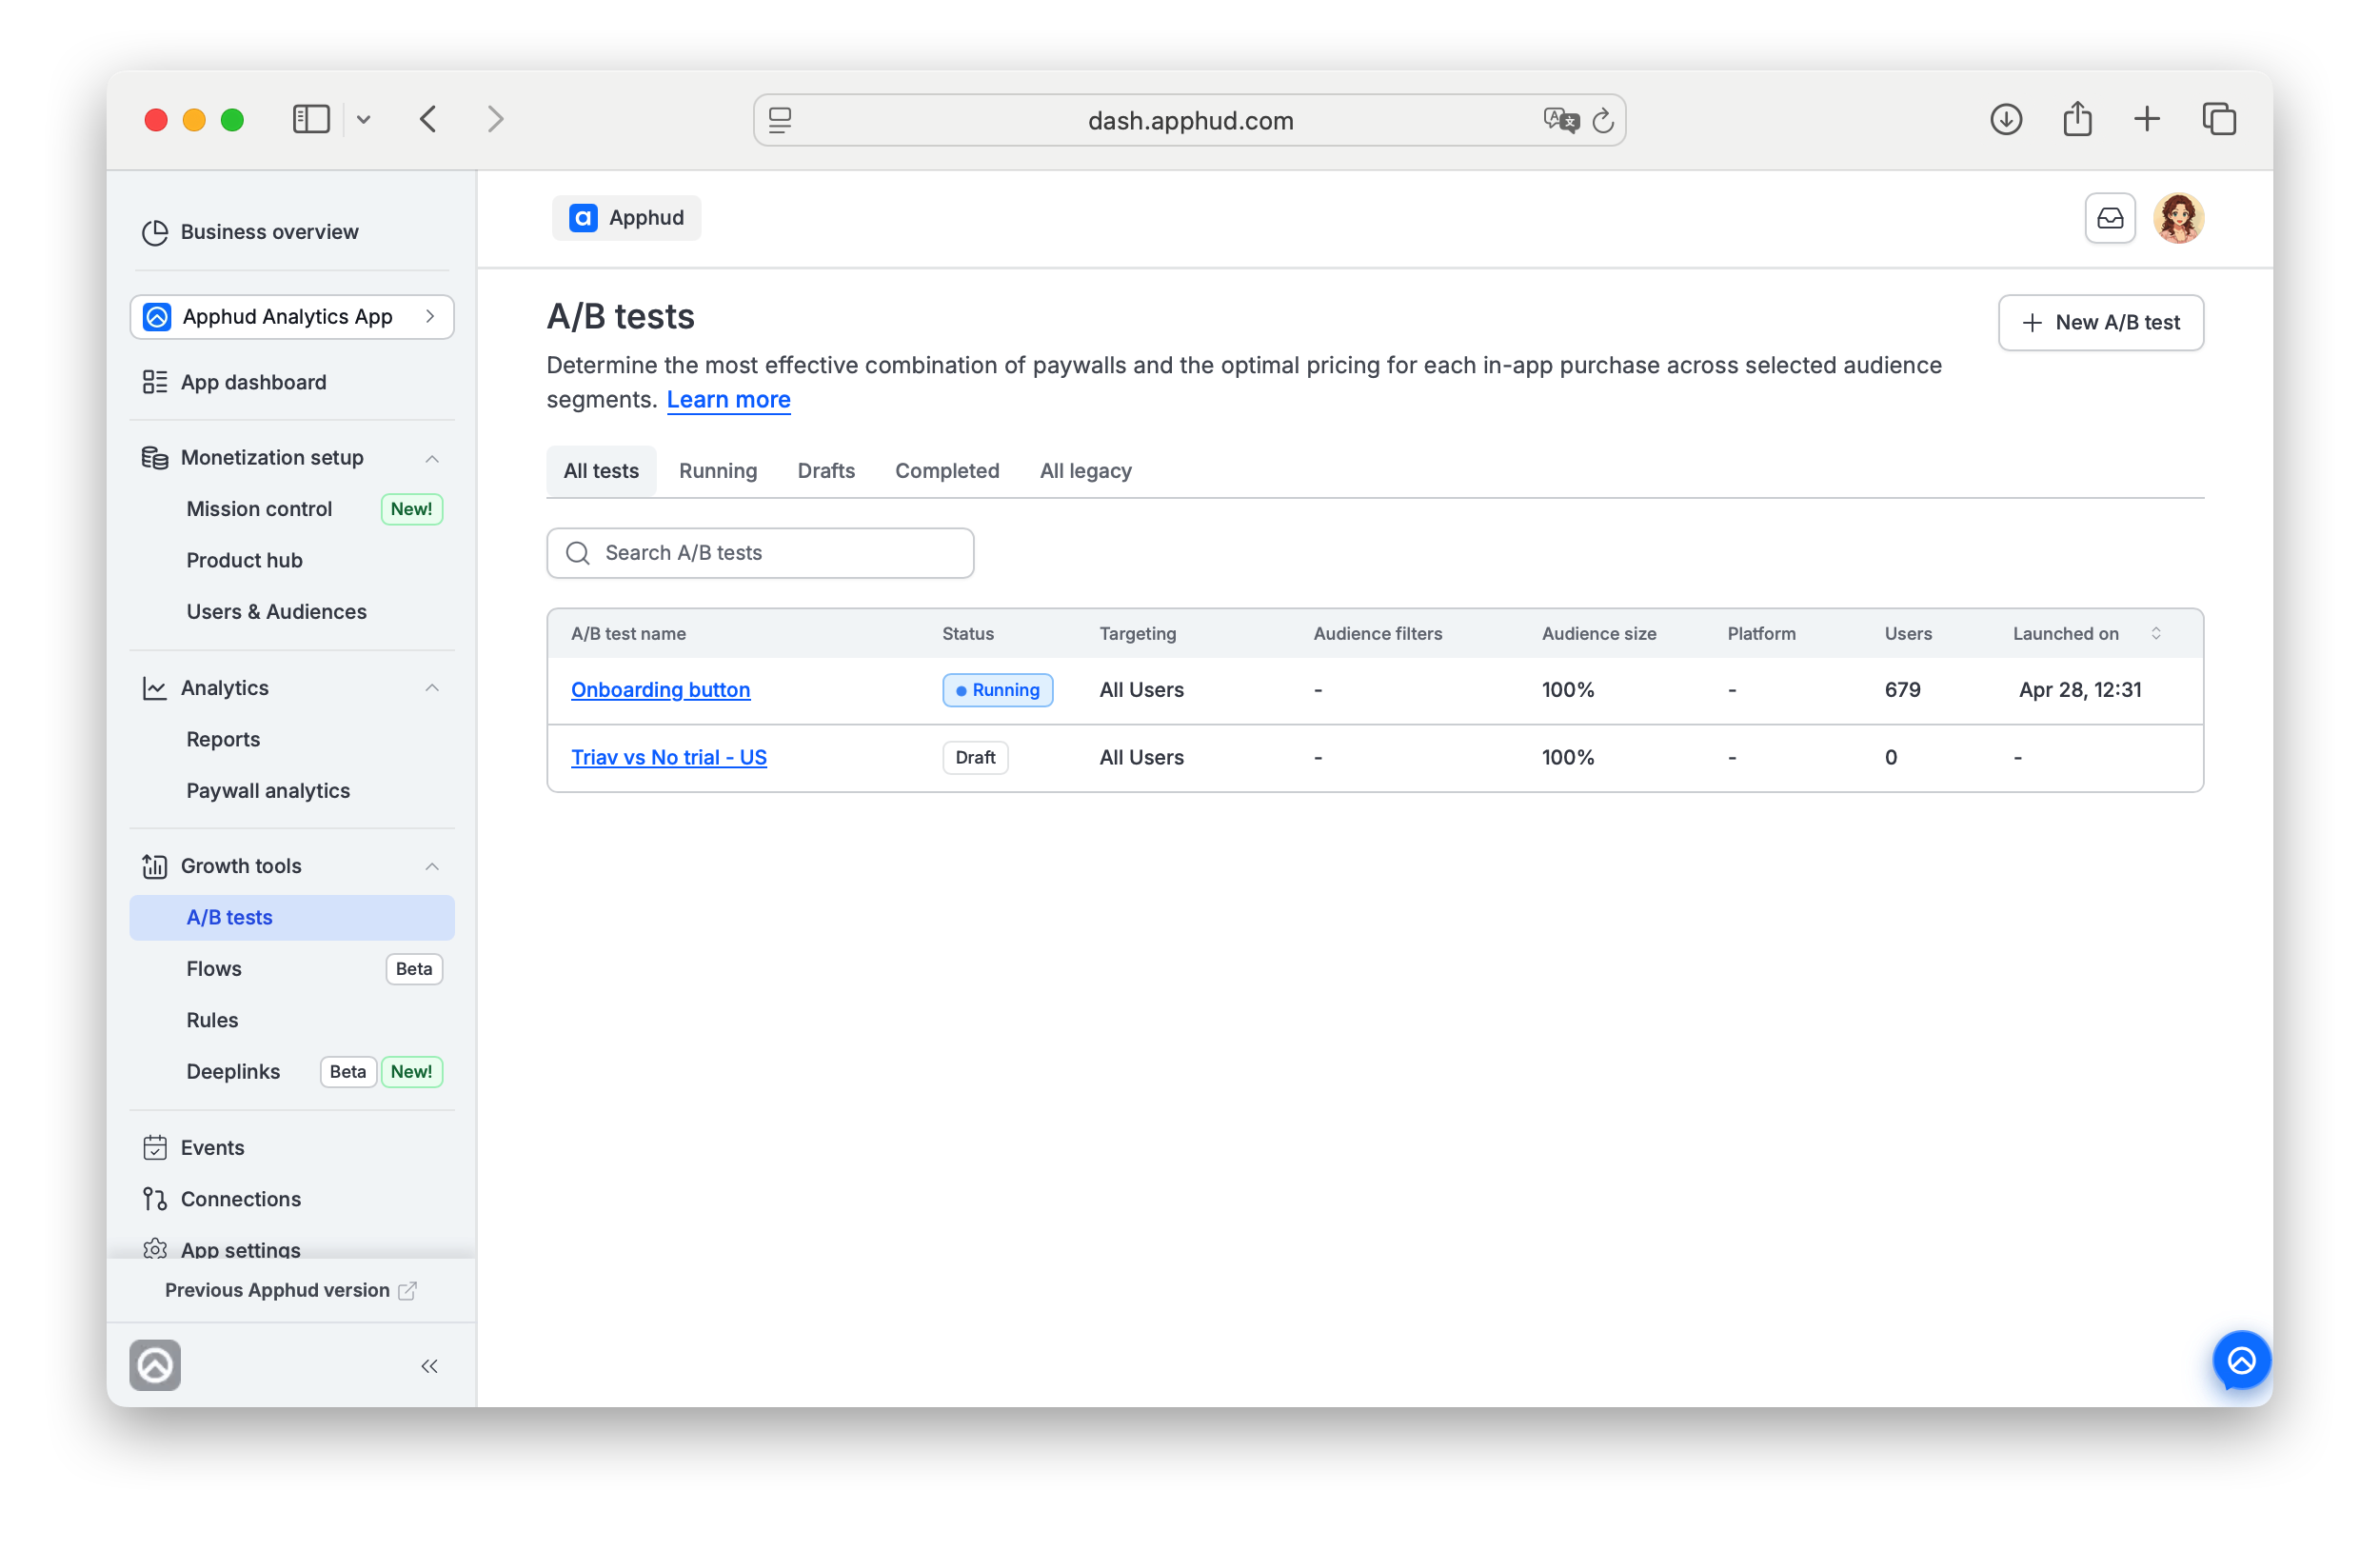
A/B tests list
The list page has five tabs and a search box.
| Tab | Contents |
|---|---|
| All tests | All Tests launched after Apphud 2.0 redesign launch (since the 1st of July, 2026). |
| Running | Active tests. |
| Drafts | Saved tests not yet launched. |
| Completed | Finished tests. Metrics are preserved; edits are locked. |
| All legacy | A/B tests created in the previous Apphud version. Read-only — new tests use the v2.0 format. |
Columns: A/B test name (link to detail) · Status · Targeting · Audience filters · Audience size · Platform · Users · Launched on (sortable).
Click a row to open the test detail page.
Test states
| State | What you can do |
|---|---|
| Draft | Edit any field. Save & return. Review & launch test. Manage test users. Delete. |
| Running | Edit Audience size. Edit Variation weights. Manage test users. Duplicate. Complete A/B test. Asset configuration is locked. |
| Completed | Read-only. Duplicate. Metrics are preserved. |
Create a test
Two entry points:
- Growth tools → A/B tests → + New A/B test — opens the targeting picker.
- From a Targeting — opens the picker with that targeting preselected.
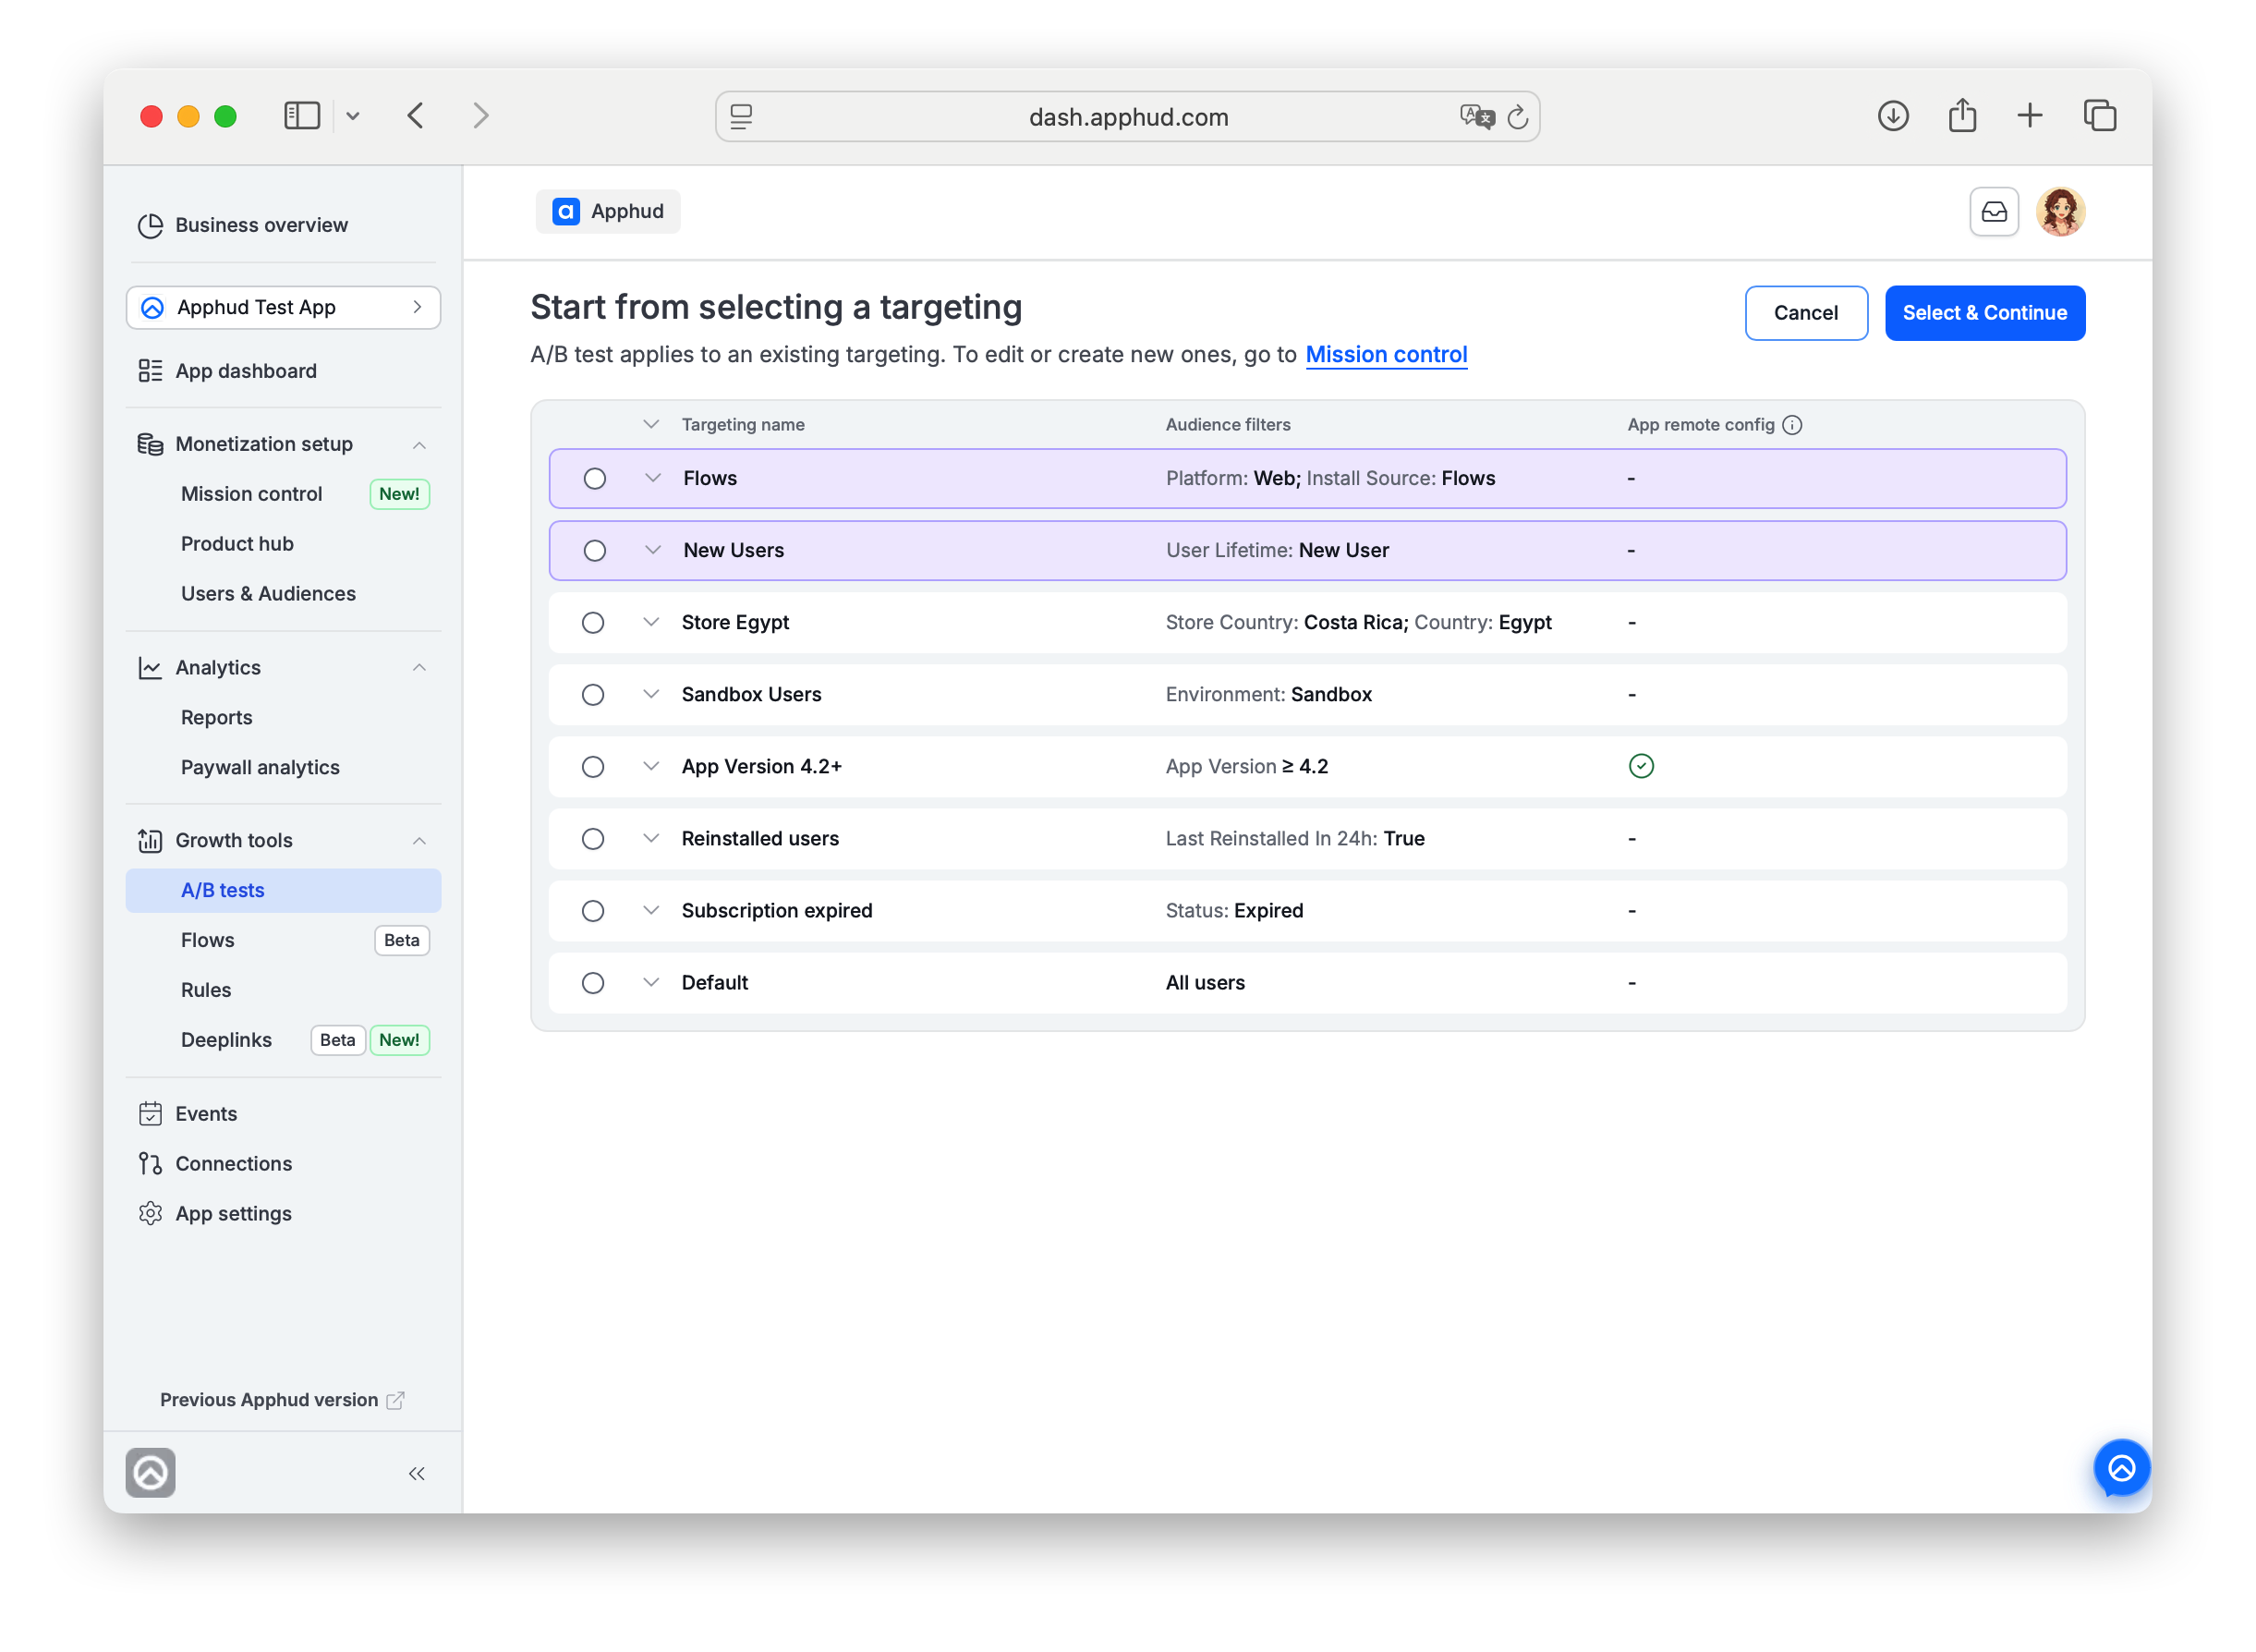
Step 1 — Pick a Targeting
The Start from selecting a targeting view lists every Targeting configured for your app.
Each row shows:
- Targeting name (chevron to expand and see the targeting's placements and paywalls).
- Audience filters — the conditions that define the targeting's audience.
- App remote config — green ✓ if the targeting has app remote config configured; otherwise
-.
Targetings that already have a Running A/B test are highlighted in purple. Pick one and click Select & Continue. A confirmation modal asks you to confirm — once you start creating the test, the targeting can't be changed.
Drafts can be saved on busy Targetings, but won't launch until the current test endsA Targeting can host only one Running A/B test at a time. You can still create and save a Draft on a Targeting that already has a Running test (Apphud doesn't warn you about this during creation), but when you try to launch it you'll get an "audience already has a running test" error.
Use this pattern to swap tests with minimal gap: prepare the successor as a Draft → Complete the current test → Run the Draft.
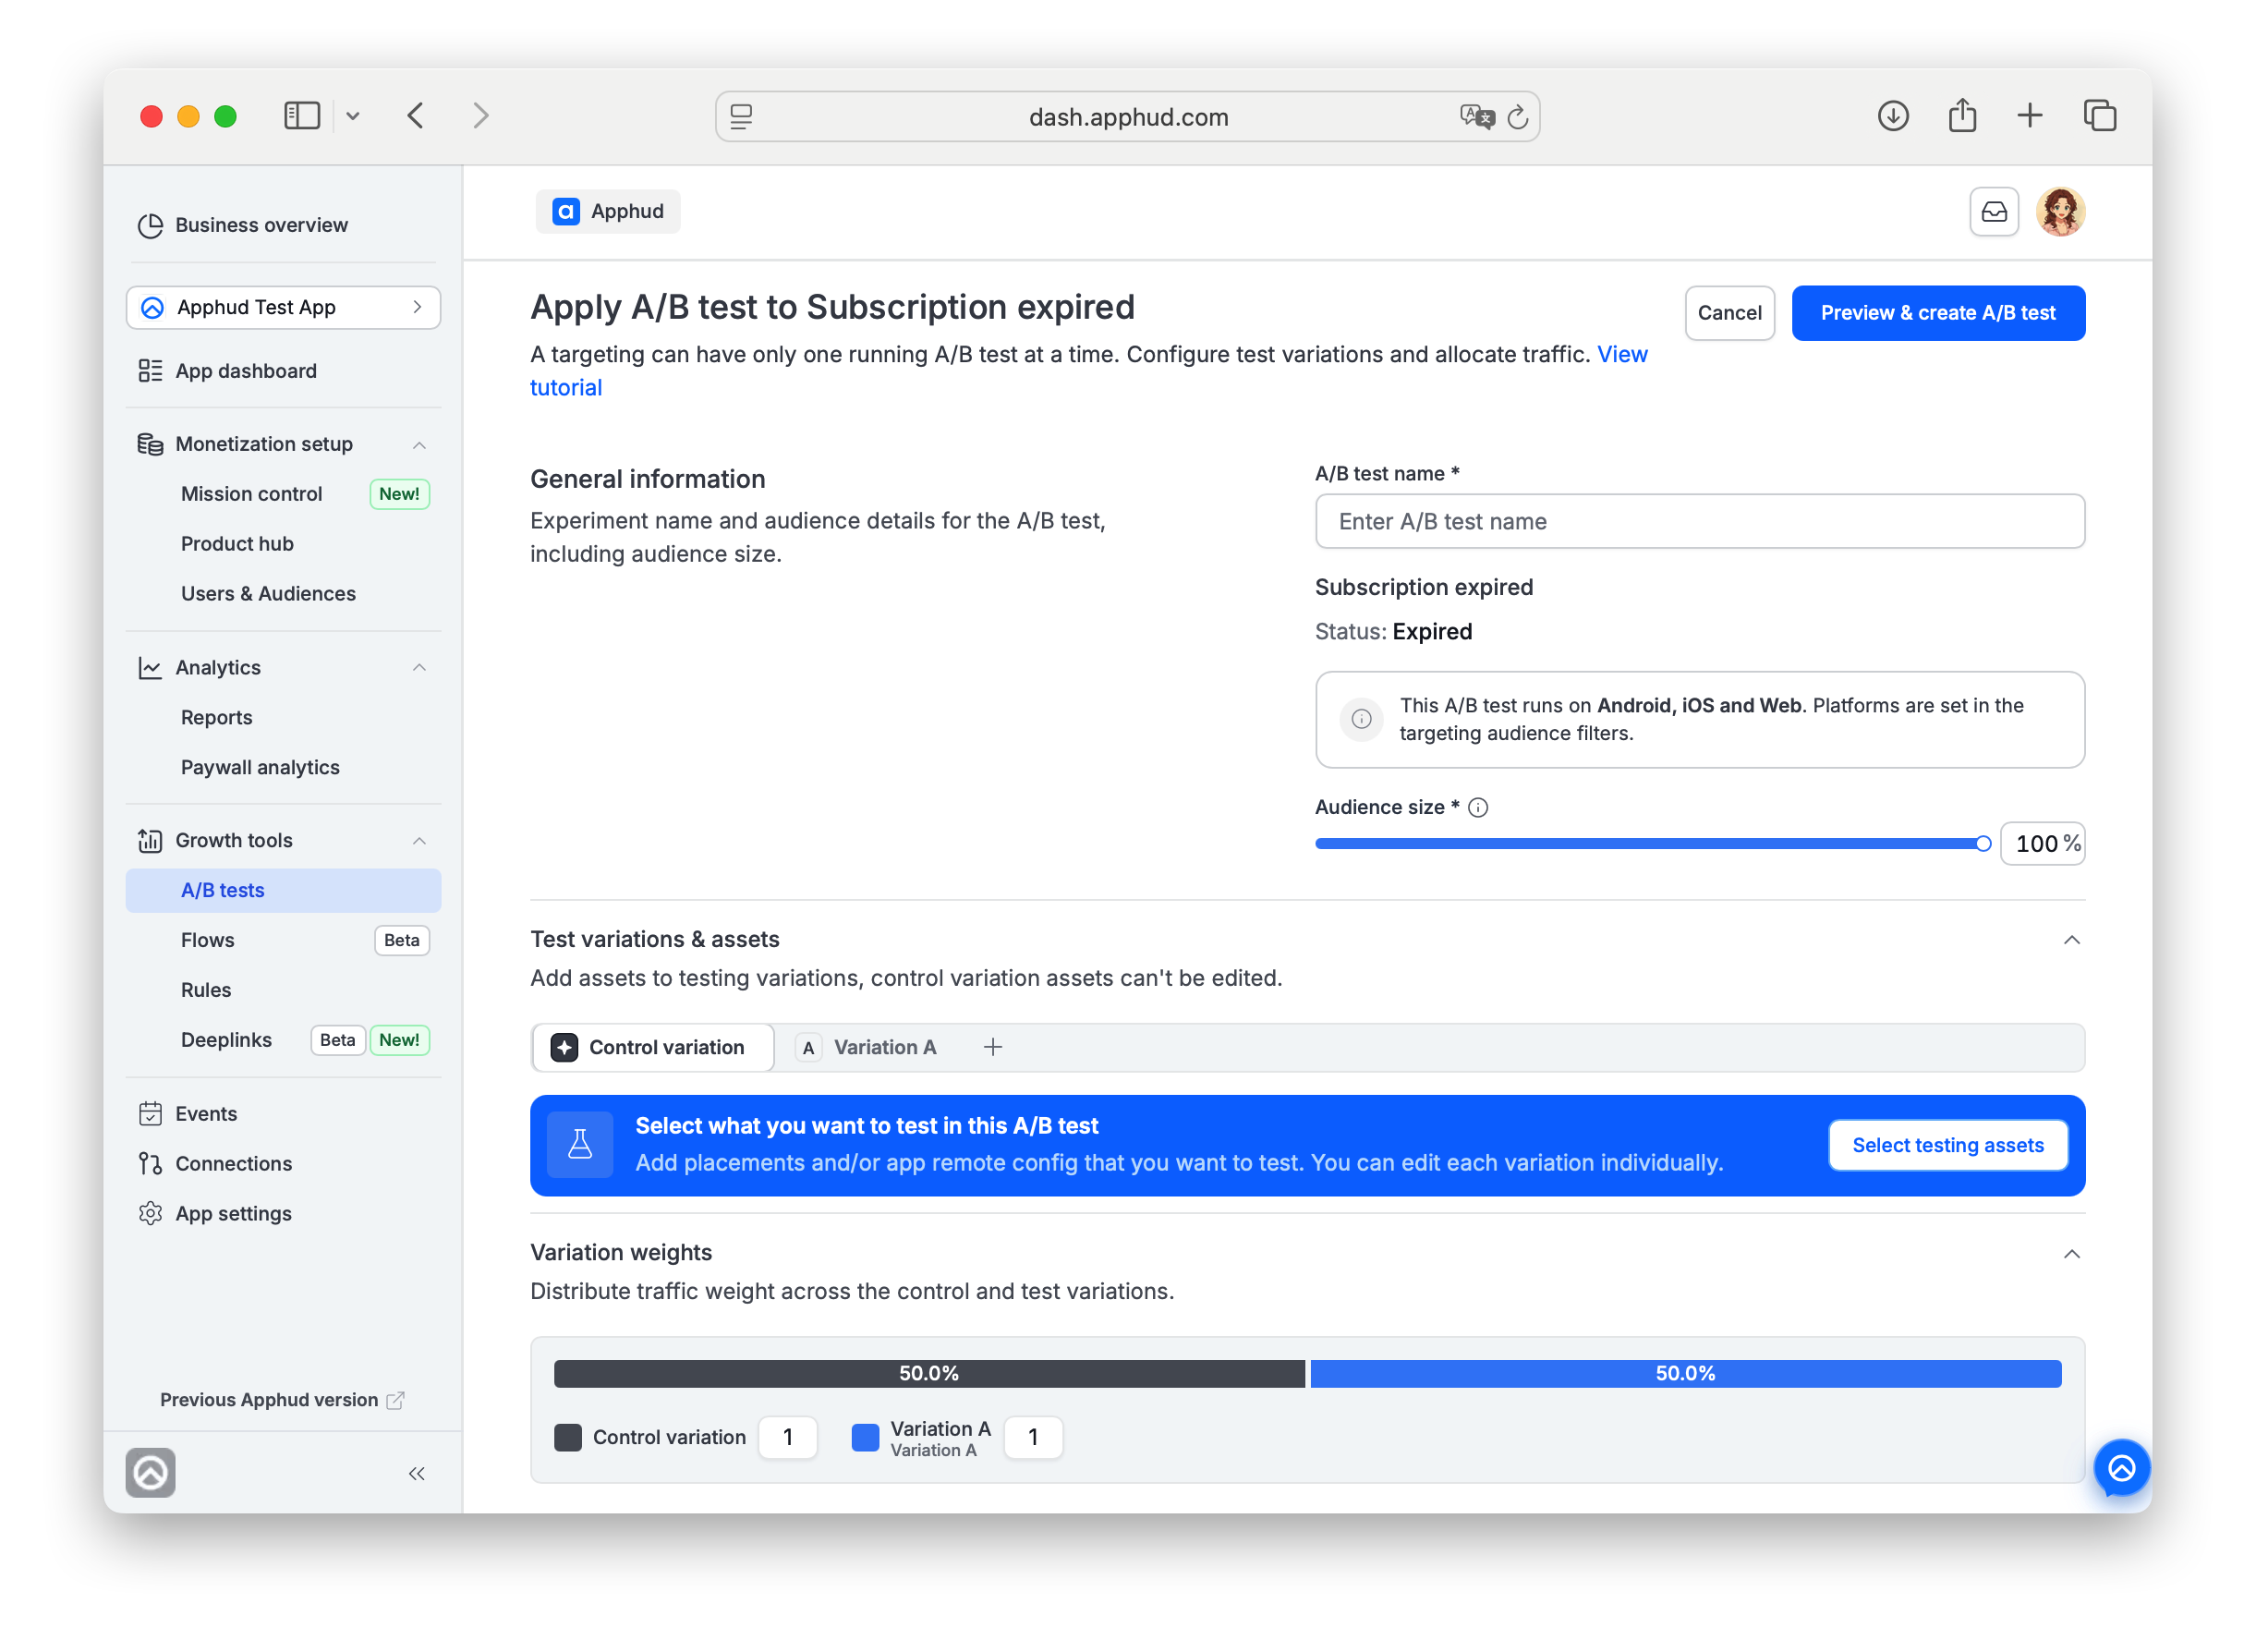
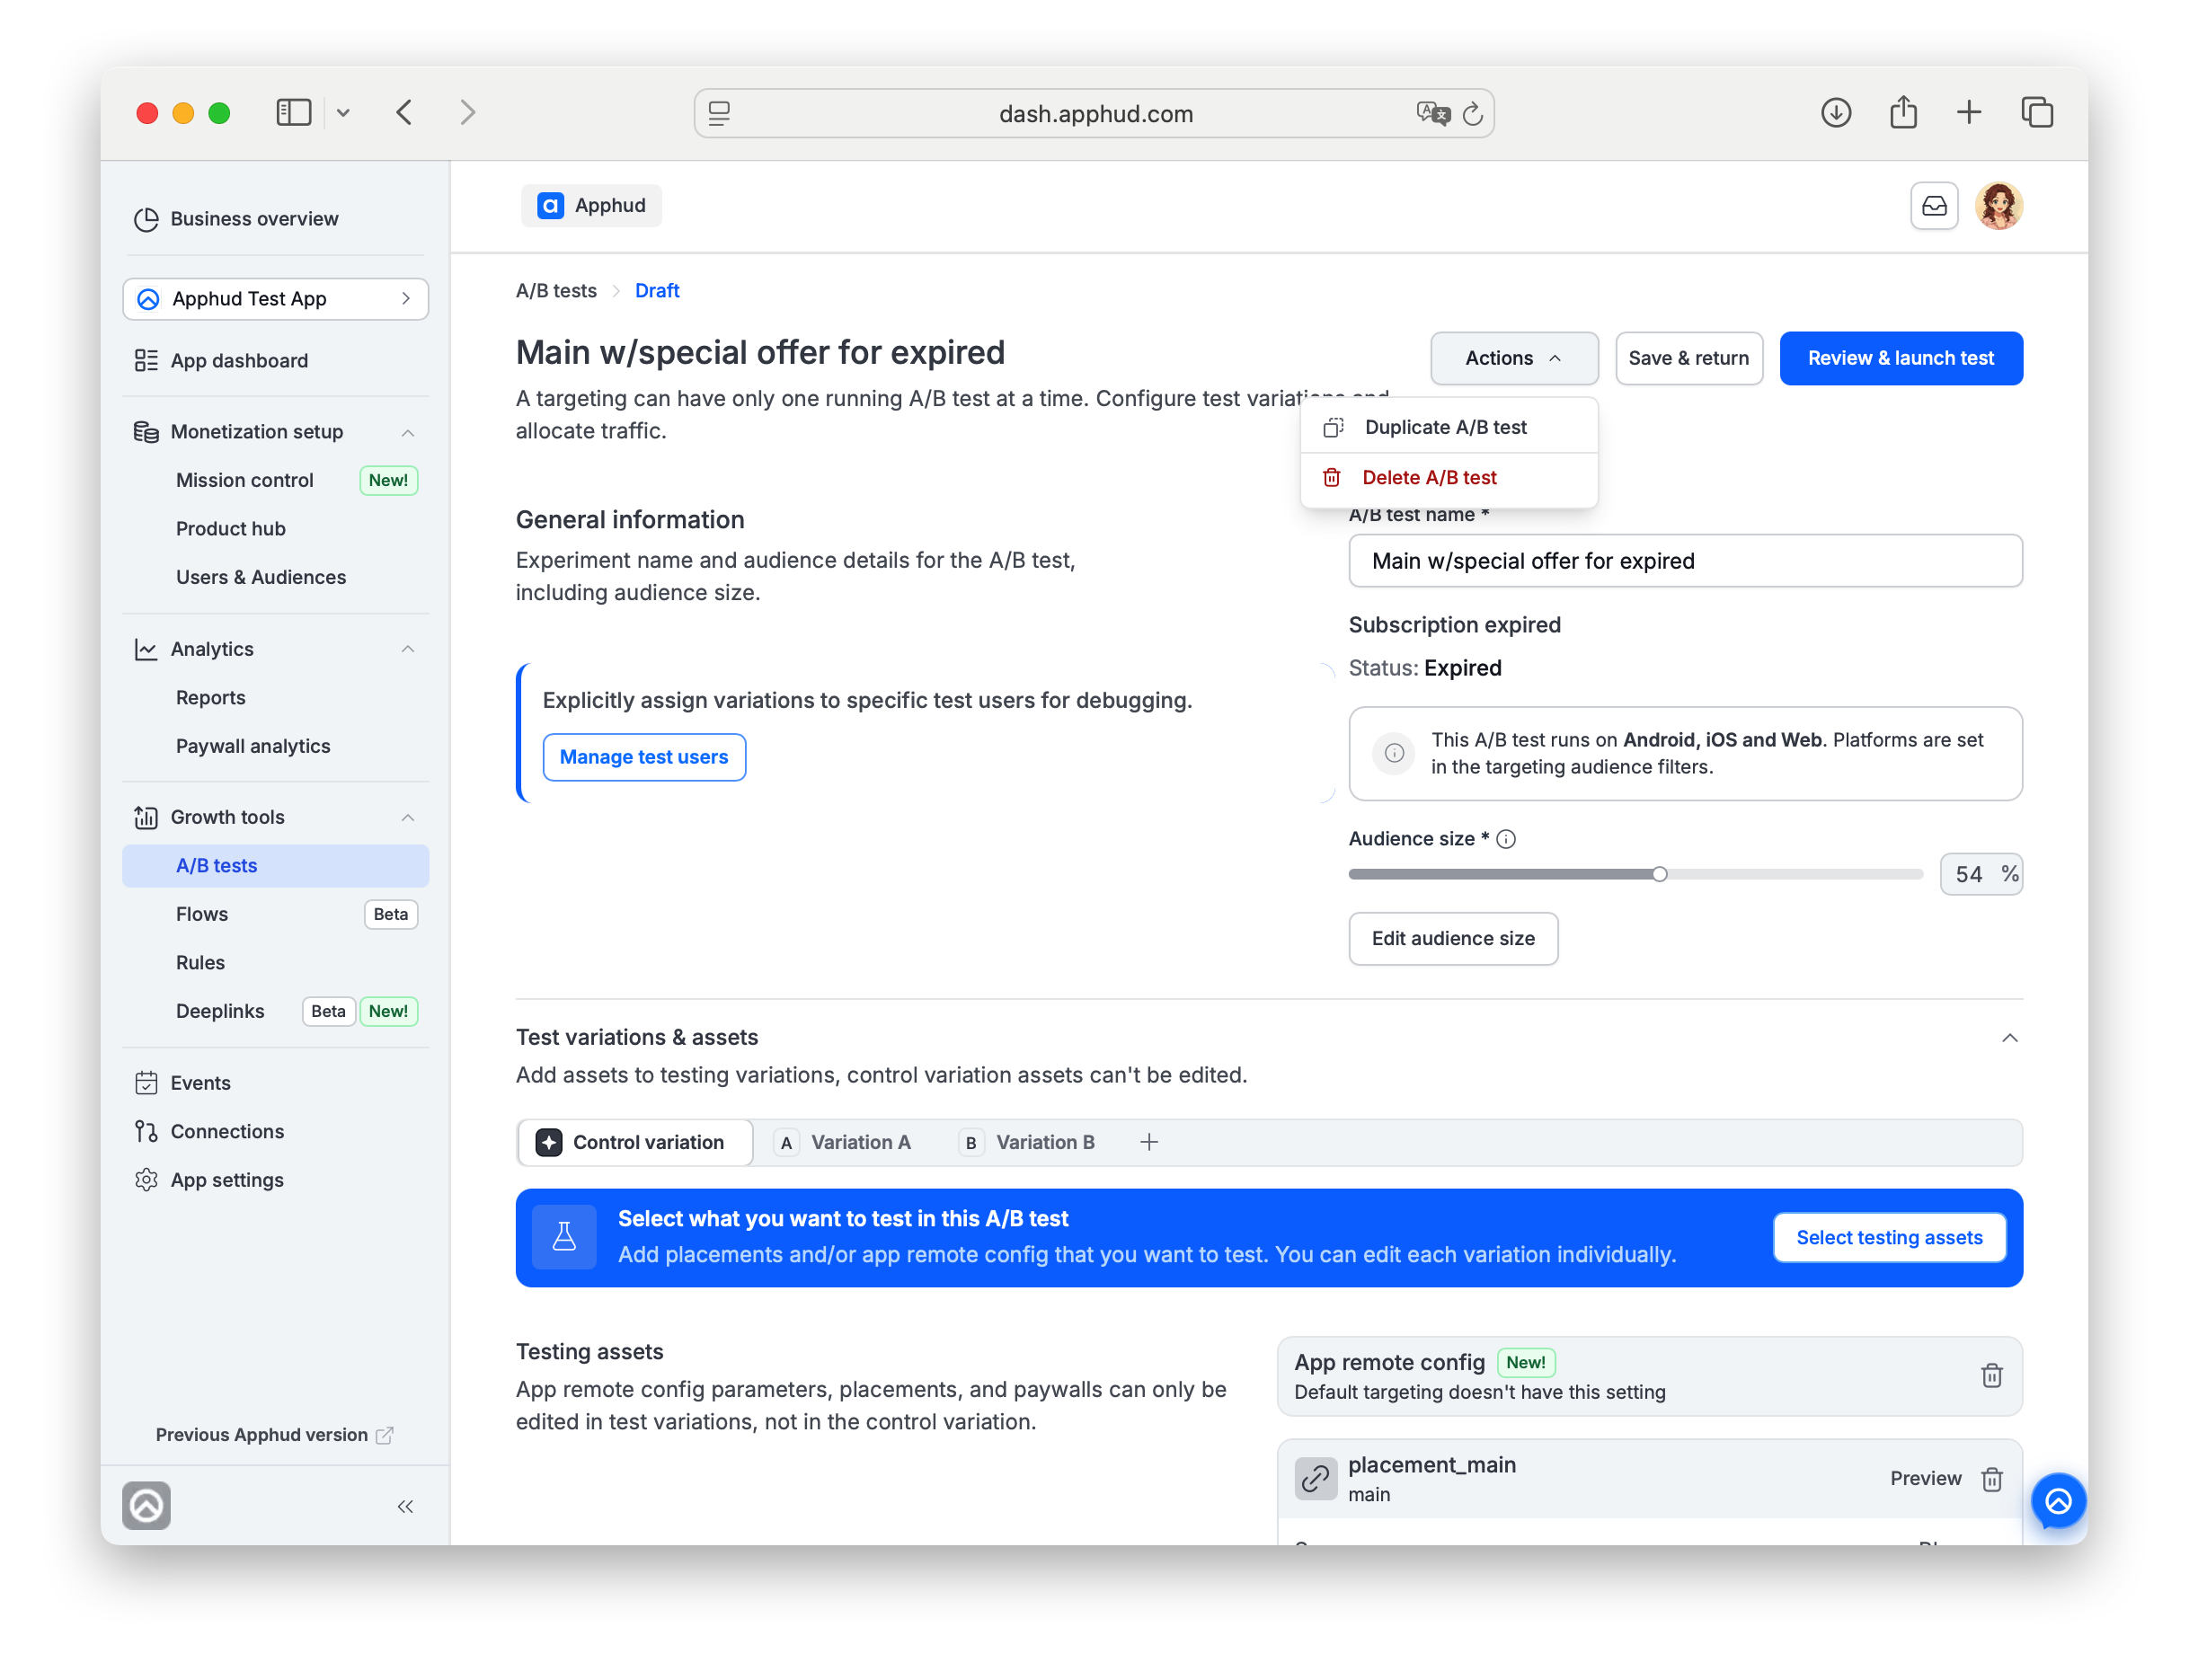
General information
The below needs to be configured first
- A/B test name (required) — name your test for the list view. Will be used as a filter in analytics.
- Audience size — slider, 0-100%. Default 100%. Use Edit audience size to change it.
- Manage test users — optional. Pin specific user IDs to specific variations for QA. See Manage test users.
- Right-side meta — the Targeting name, audience filters, and platforms (set by the Targeting, not editable here, e.g. "Subscription expired" and "Status: Expired").
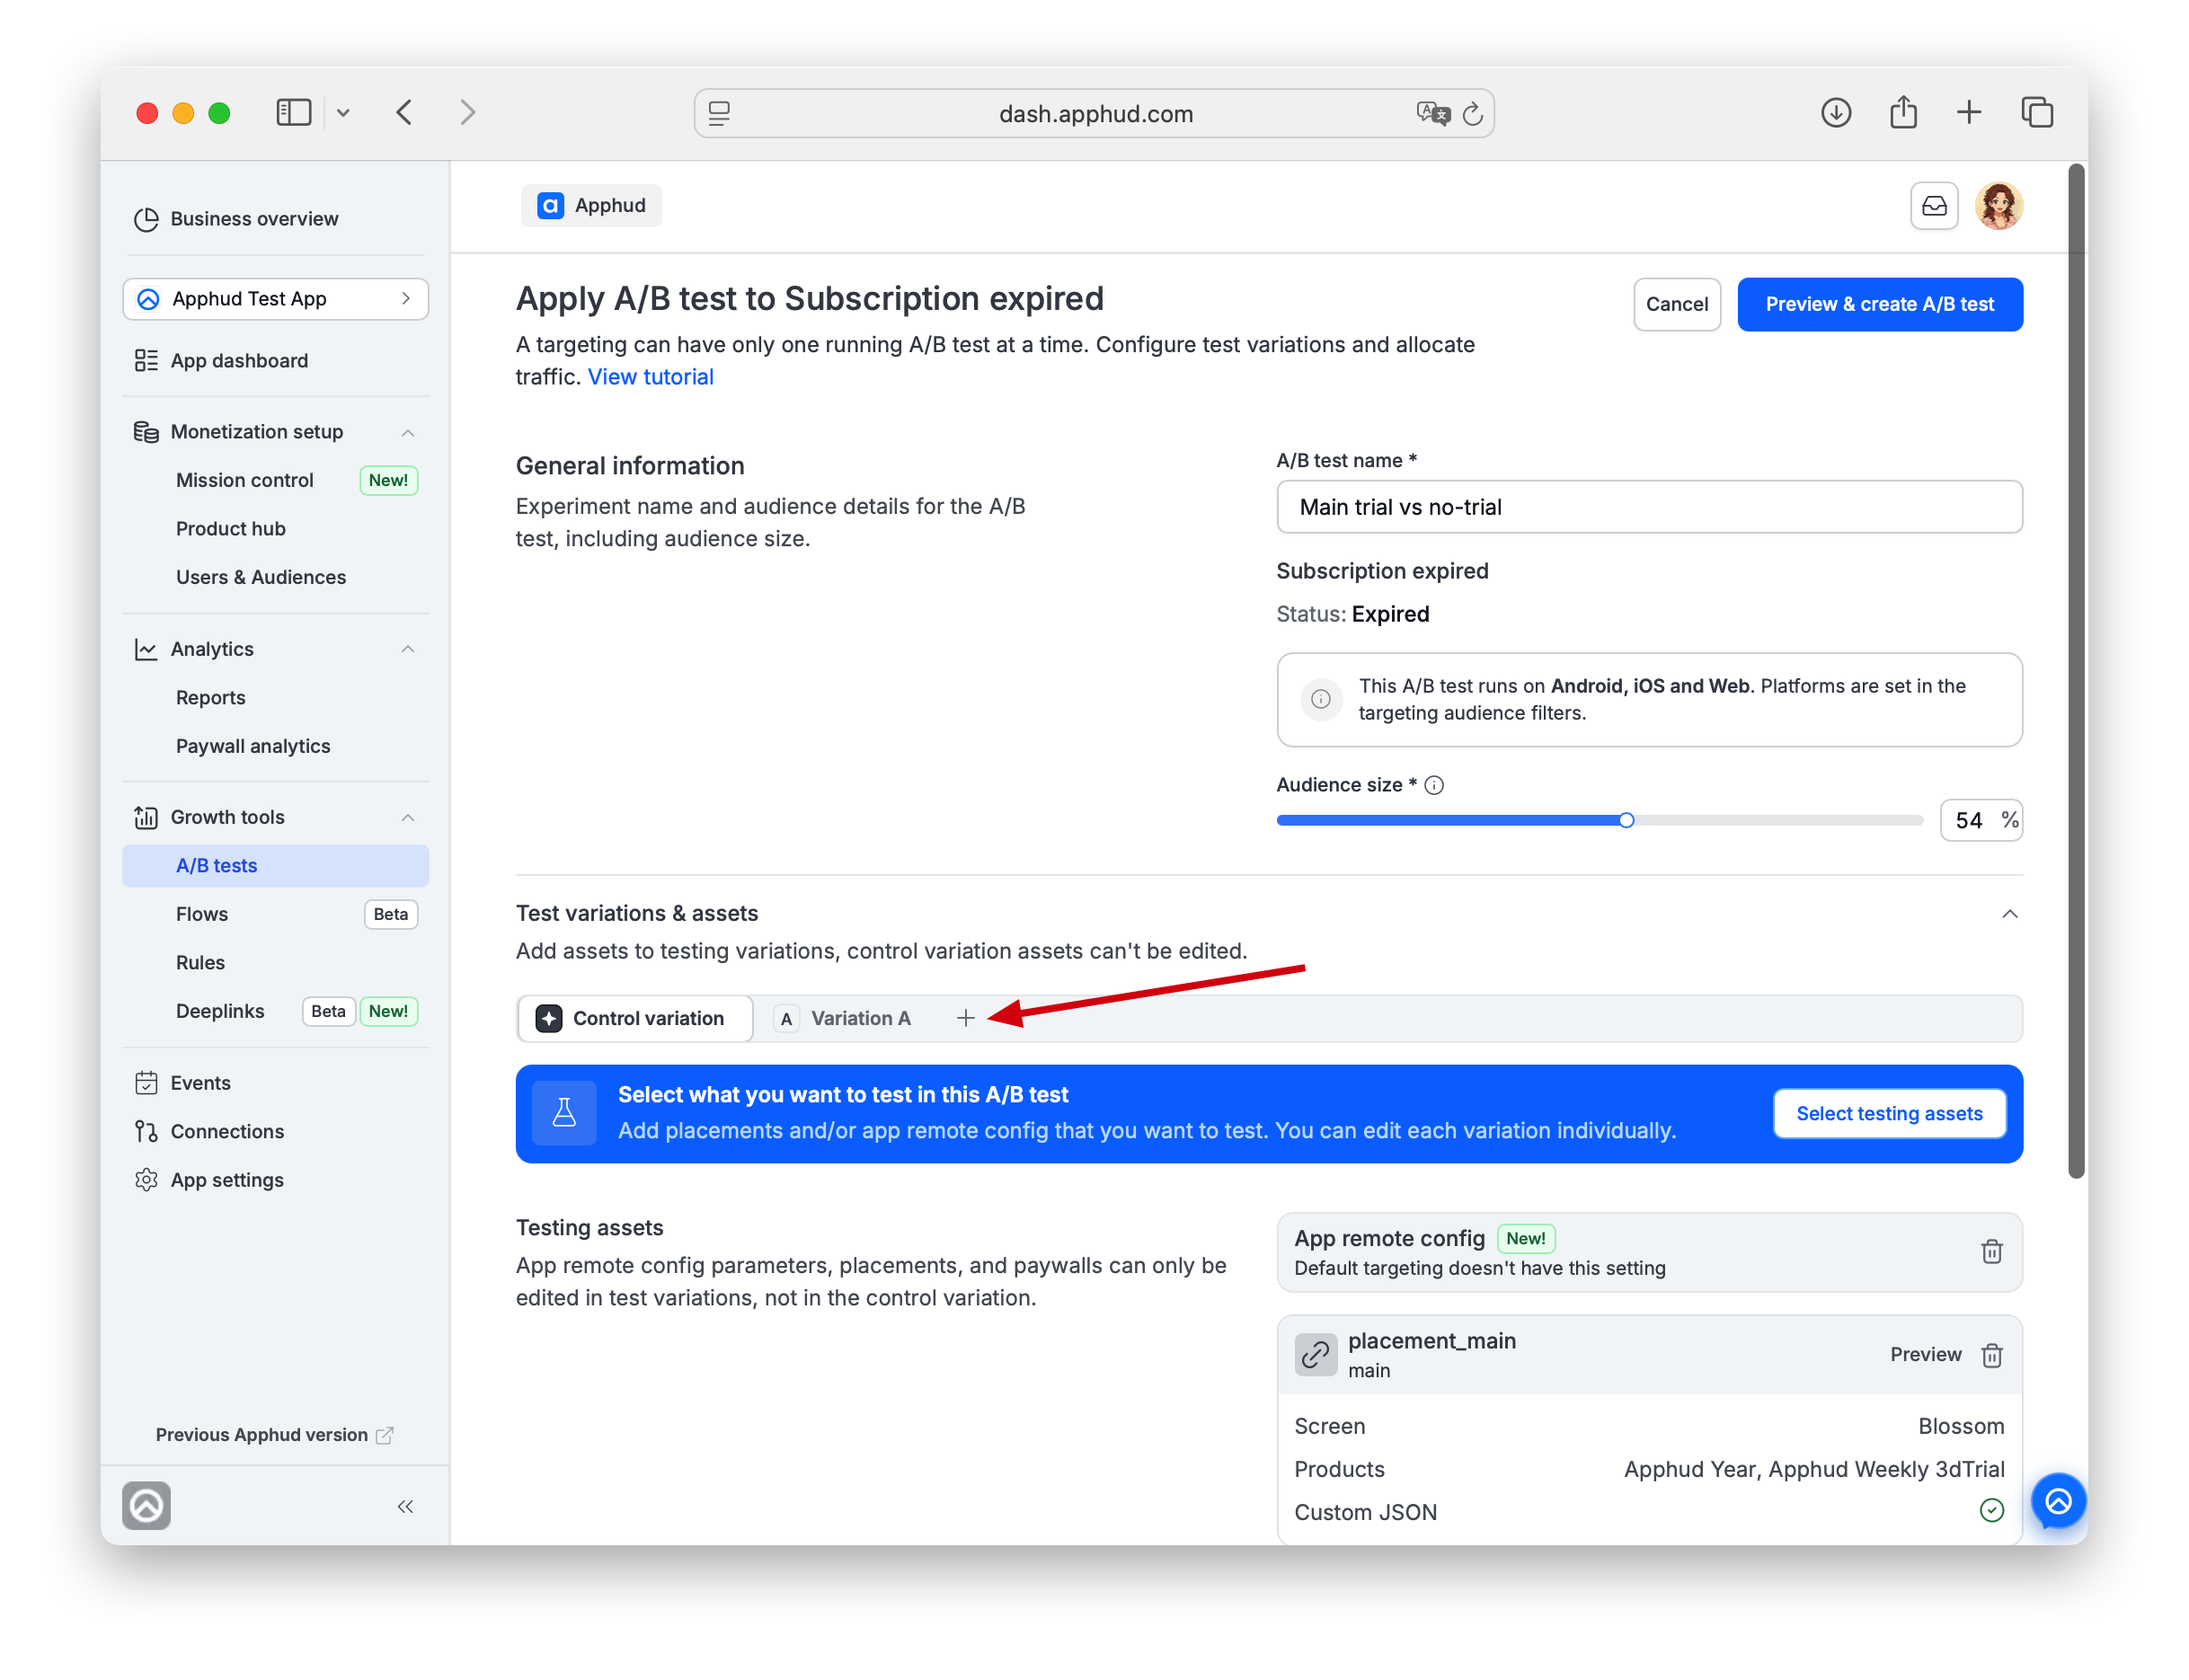
Step 2 — Pick assets to vary
Click on Select testing assets button on the banner asking to select a testing object(s).
The Select what you want to test modal asks which of the Targeting's assets your test will vary:
- App remote config — checkbox at the top. Opt in to test different JSON configs delivered to your SDK.
- Placements & paywalls — pick one or more of the Targeting's placements (each shows its currently-assigned paywall and screen).
Put checkmarks in all objects you'd like to test. Click Select assets. You land on the Draft test detail page with Control variation showing the selected objects.
Step 3 — Configure the Draft
The unsaved Draft detail page has two top-of-page actions:
- Cancel — deletes the traft Draft.
- Preview & create A/B test — proceed to the preview step.
Test variations & assets
- Variation tabs: Control variation (locked — serves whatever the Targeting serves) + Variation A / B / C / D (up to 5 test variations total).
- Click the + at the end of the tabs to add a new variation.
- Click a test-variation tab to configure it:
- Variation name — defaults to "Variation A" / "B" / etc.; rename for clarity.
- App remote config (if you opted in at Step 2) — JSON editor. Write the config this variation will deliver to the SDK.
- Per-placement card — one card per placement you chose. The card shows the current paywall and a Configure button to override it for this variation. Configure opens the same paywall picker / editor as in Paywalls.
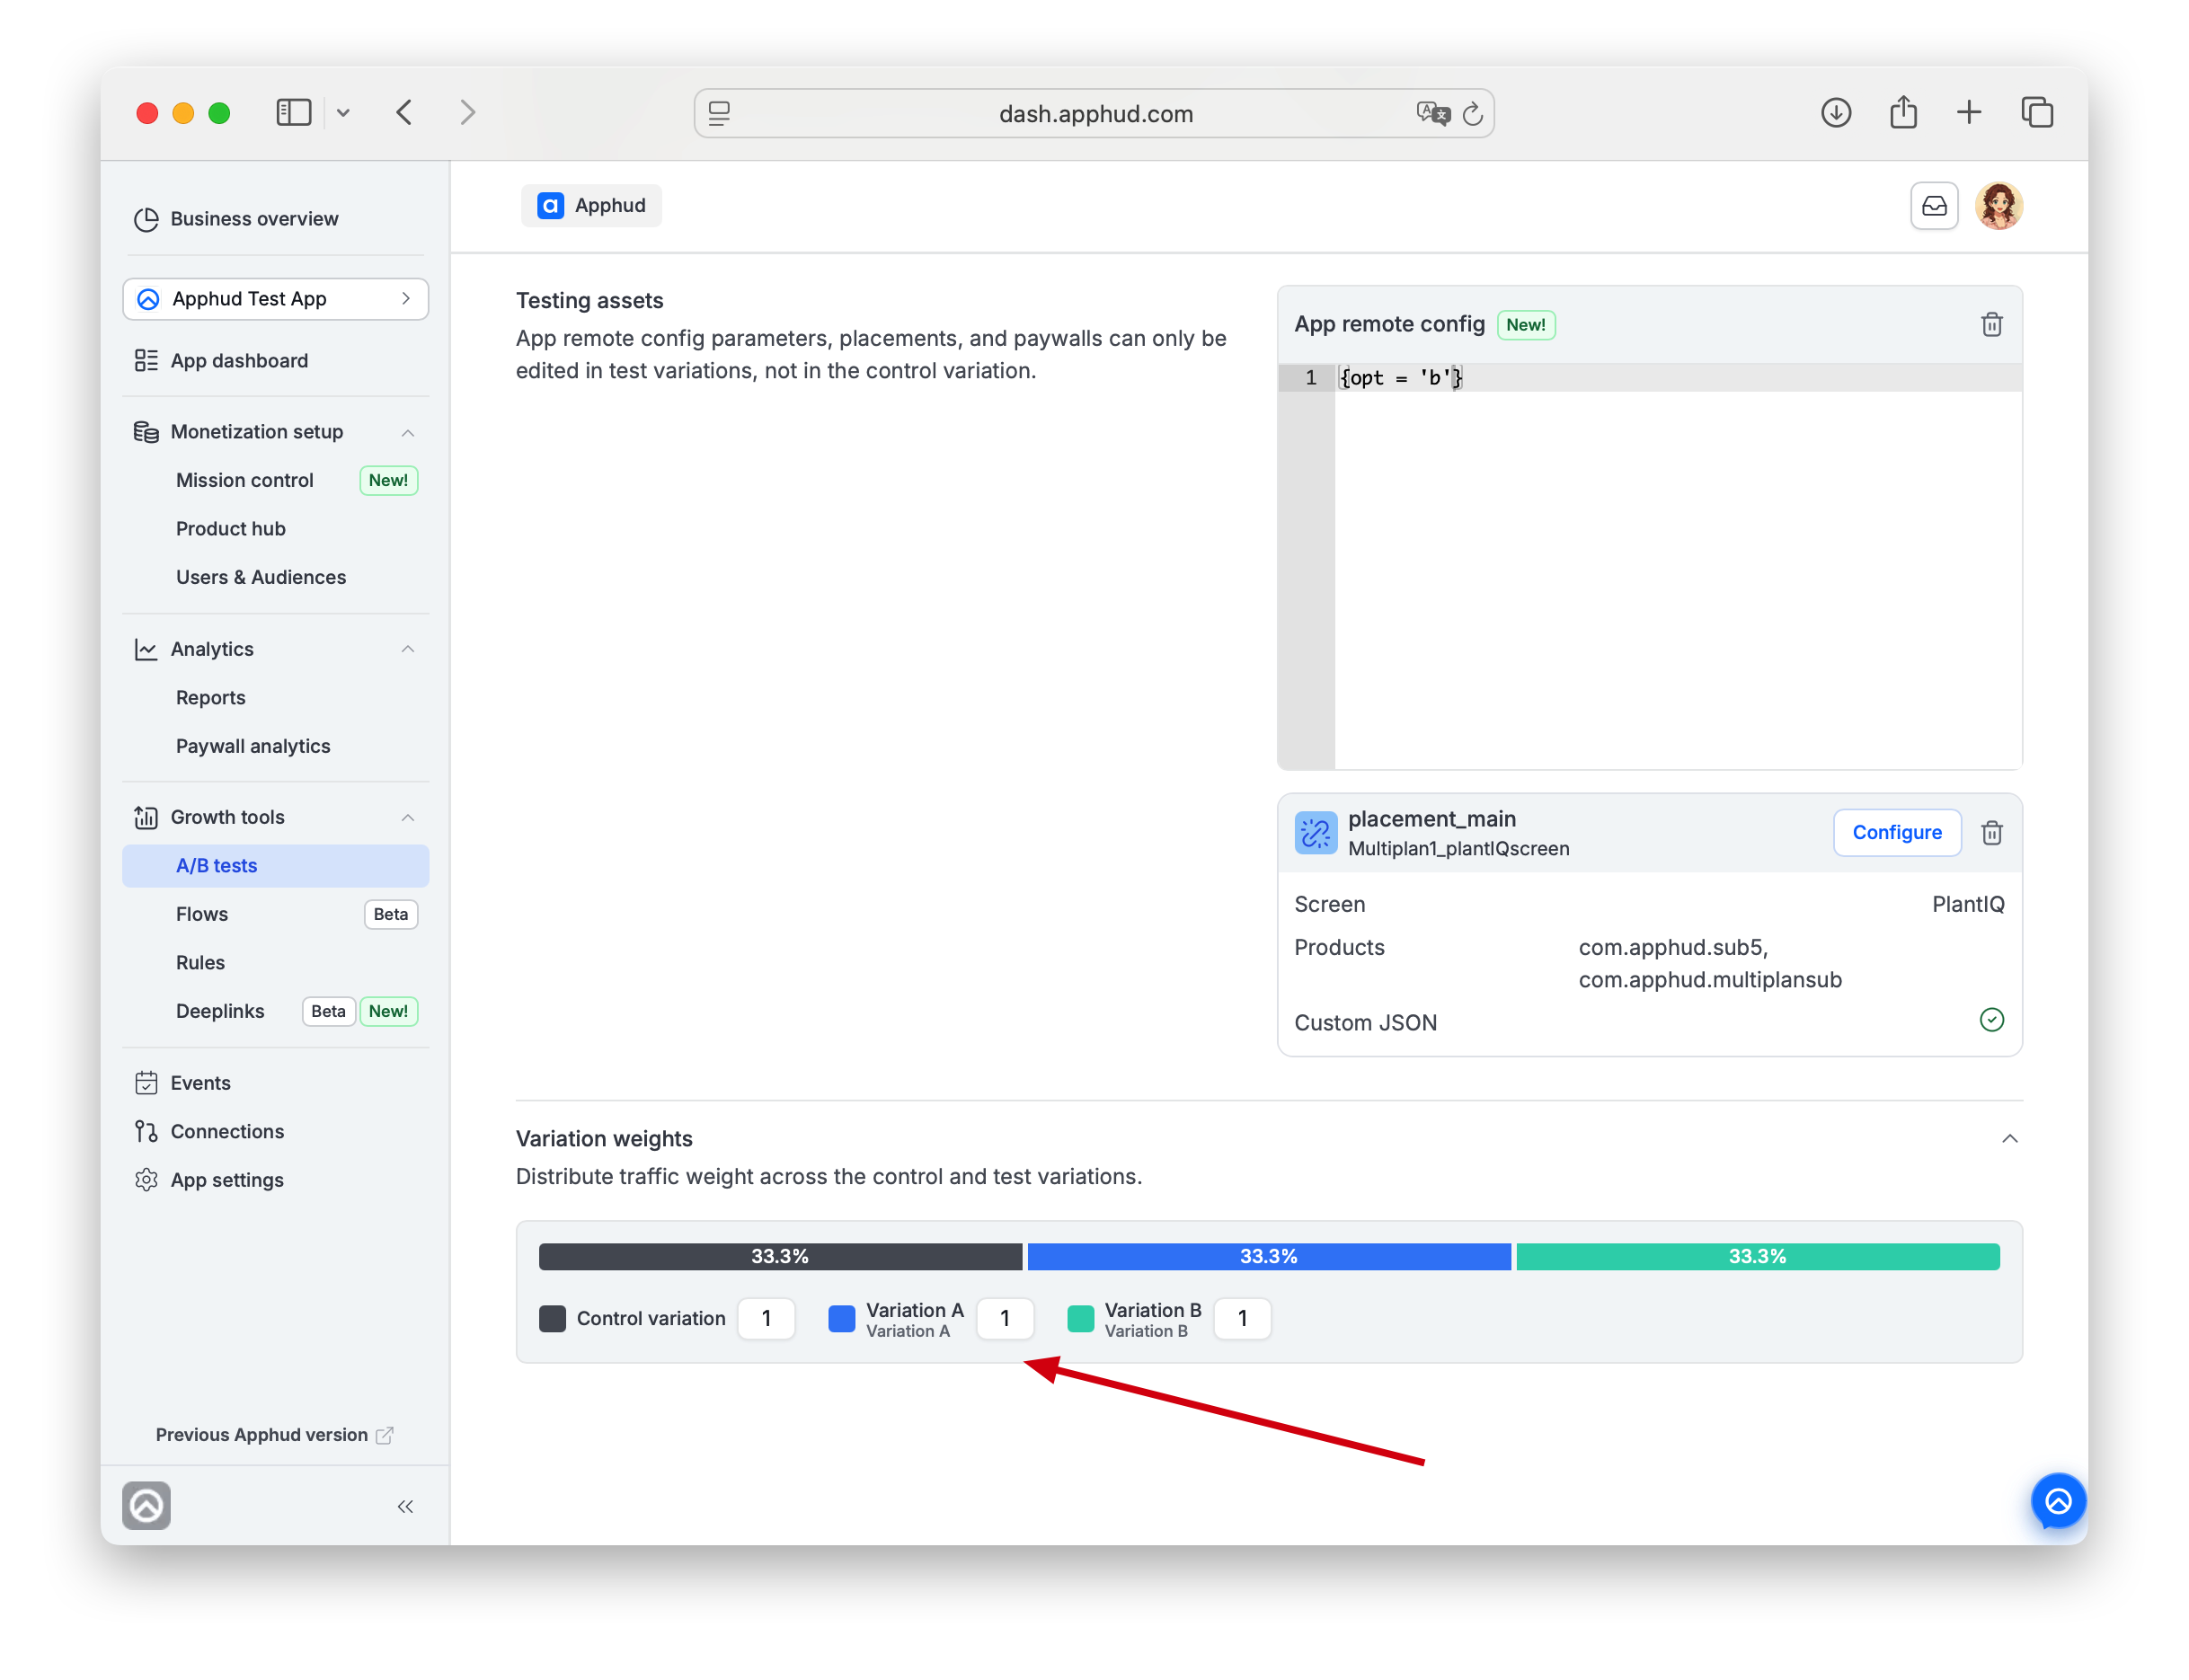
Variation weights
Distribute traffic across Control + test variations using whole-number ratios (e.g., 1:1 = 50/50, 1:2 = ~33/66). The UI shows both the ratio inputs and the resulting percentage bar.
Editable any time before launch — and also after launch (Running tests).
Step 4 — Review & launch
Once all variations are configured, click Review & launch test. The Preview A/B test testing assets page shows the final state:
- Per-variation rows with weight, paywall, products, and JSON ✓.
- A Placements not used in A/B test callout (if any) — placements that belong to the Targeting but weren't included in any test variation.
Unused placements still work — they just don't reportPlacements you didn't include in any variation continue to serve their normal paywall to users in the test. They just won't appear in A/B test reports.
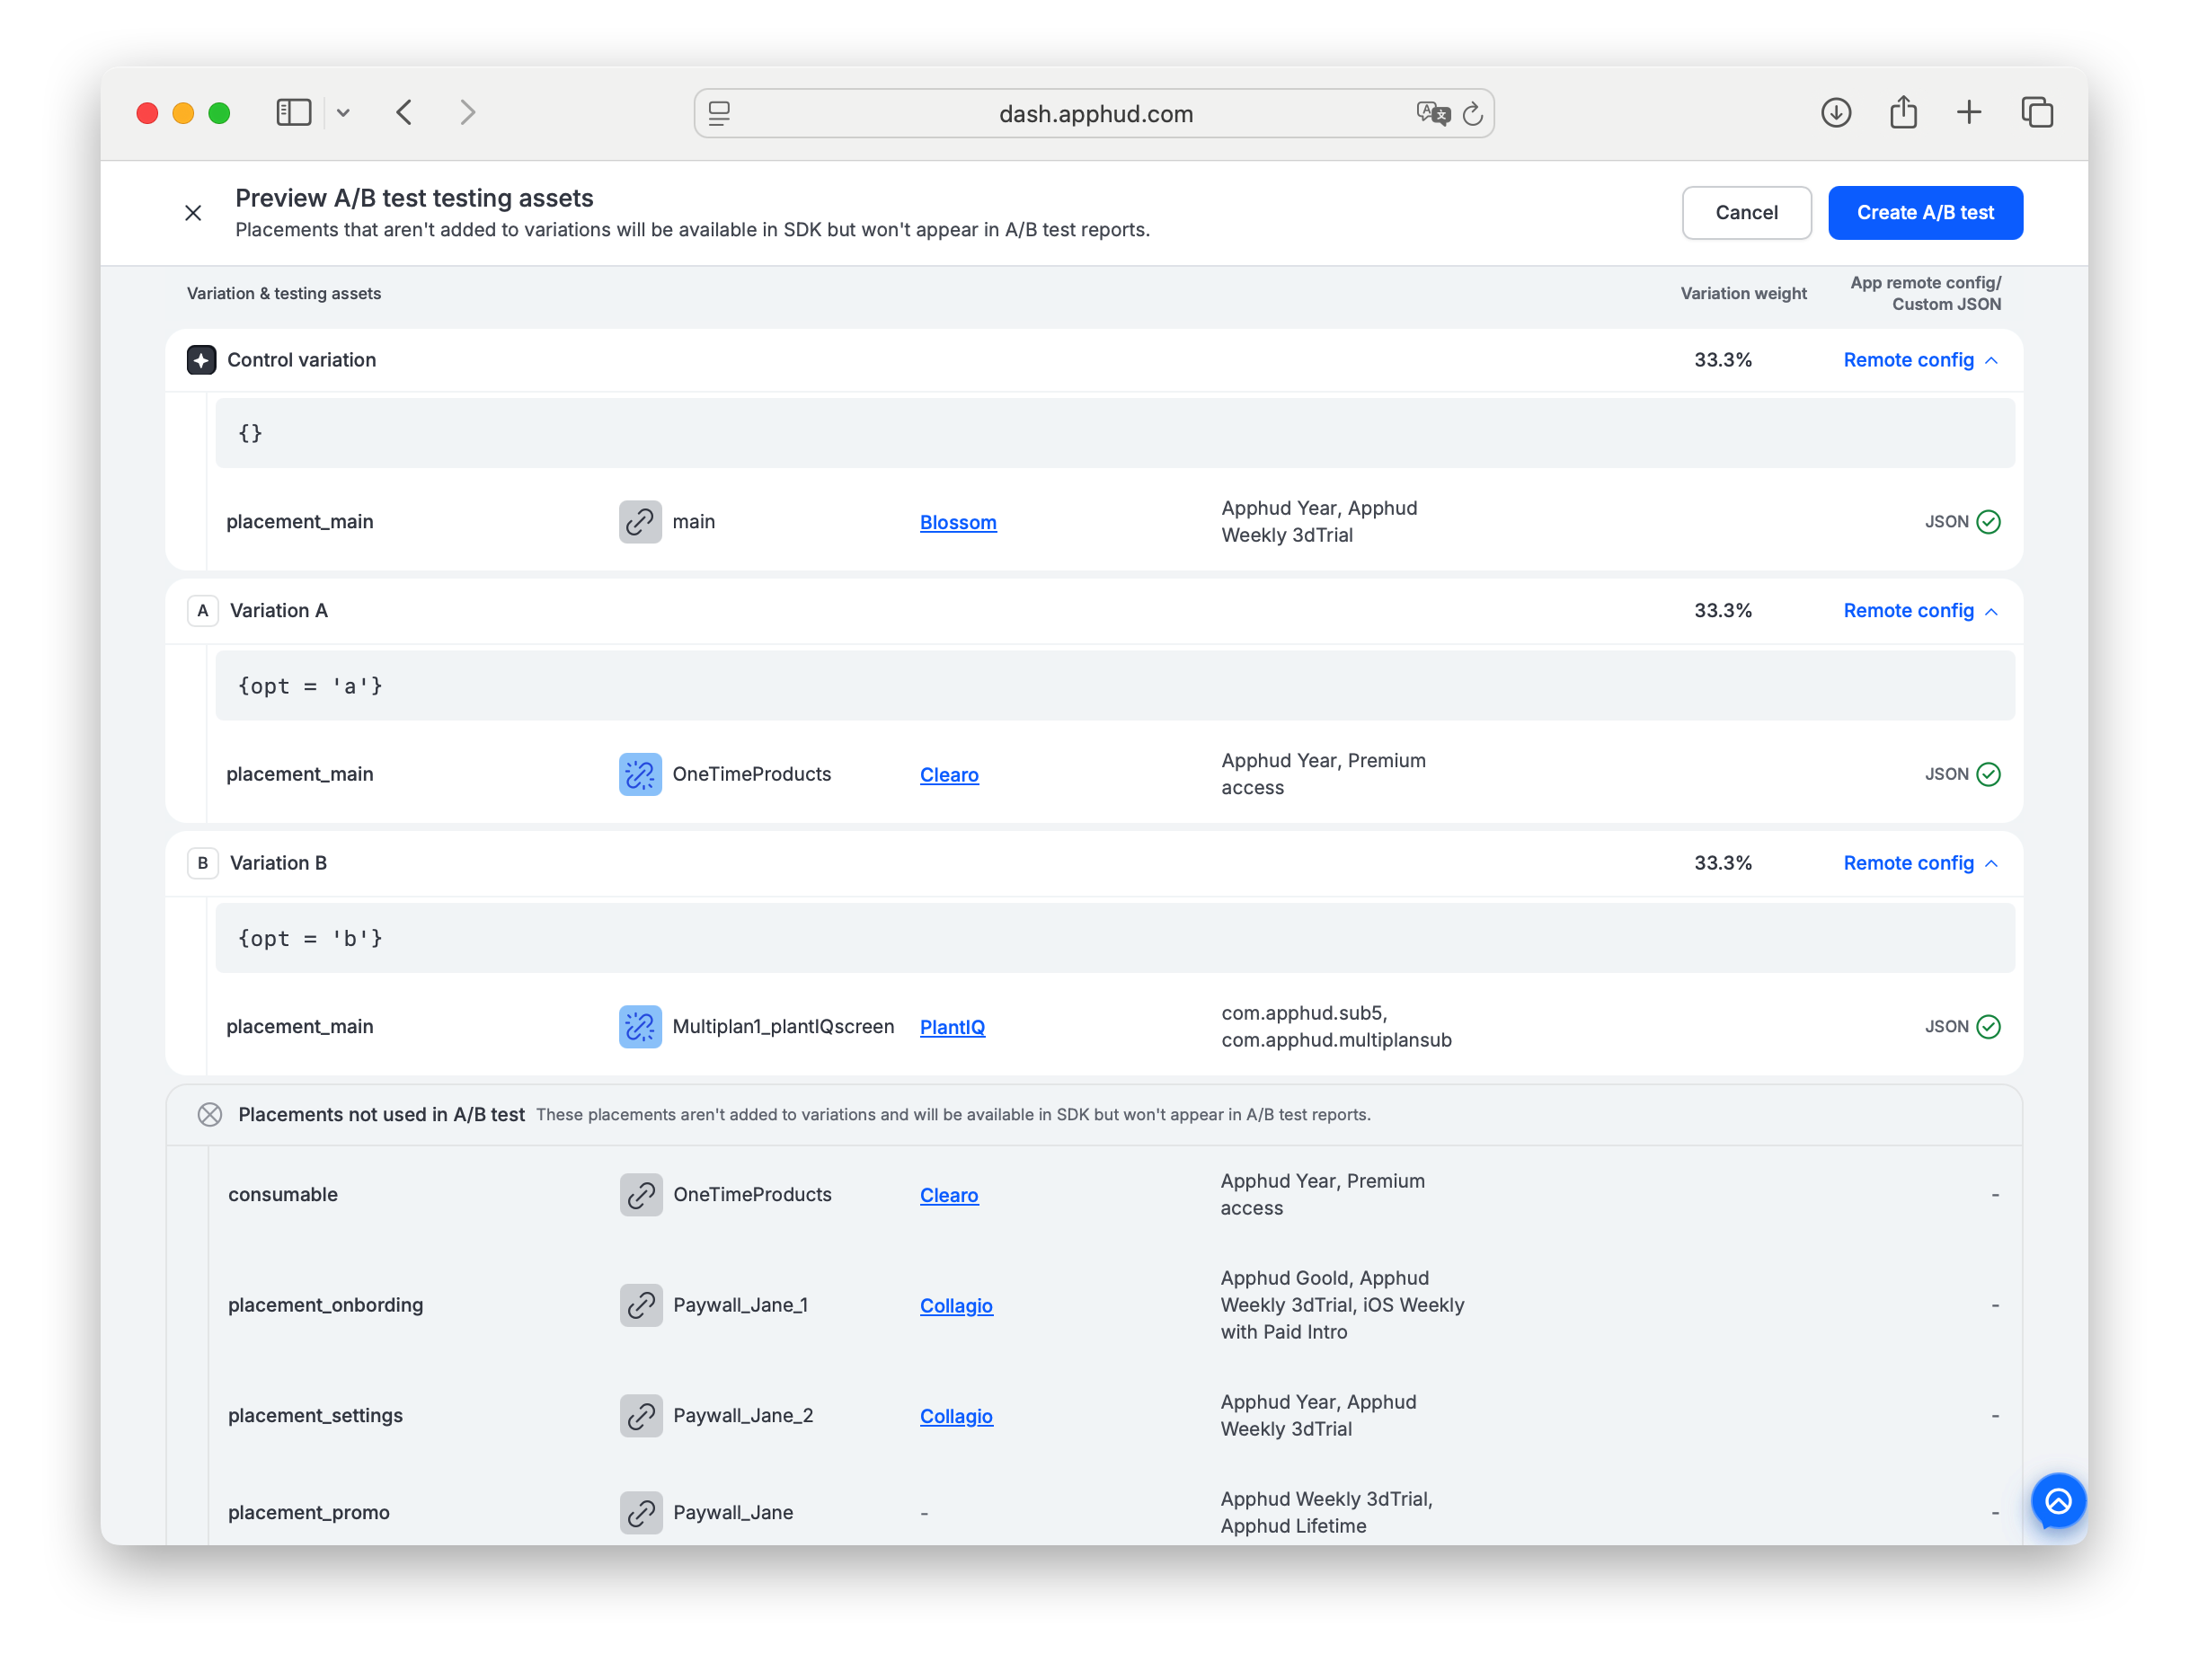
Click Create A/B test to save the Draft.
Launch A/B test
The saved Draft test page has three top-of-page options:
- Actions — allows to duplicate or delete the draft.
- Save & return - allows to adjust and save the draft
- Review & launch test — moves from Draft to Running and starts allocating users.
Audience size
The Audience size slider sets the share of matching users that enter the test.
- 100% — every user matching the Targeting is allocated to one of the variations.
- 0% — no new users are allocated. Users already in the test stay in their variation.
- Intermediate (e.g., 50%) — proportional allocation among new users matching the Targeting.
Users not allocated to this test (because audience size < 100% or because they don't match the Targeting) follow the normal Targeting rank and fall into the next matching Targeting.
Audience size is editable on a Running test.
Variation weights
Variation weights split the entered users across Control + test variations.
- Weights are entered as ratios (whole numbers).
Control 1 · Variation A 1= 50/50.Control 1 · Variation A 2= ~33/66. - The UI shows both the ratio inputs and the resulting percentages.
Why ratios?In the previous Apphud version weights were entered as percentages. Users sometimes set them to combinations that didn't sum to 100%. Ratios remove that ambiguity. The percentage bar is still shown so you see the resulting split at a glance.
Weights are editable on a Running test.
Manage test users
Manage test users lets you pin specific user IDs to specific variations, overriding normal traffic allocation. Useful for QA and debugging.
To add:
- Open the test's General information.
- Click Manage test users.
- Click + Add user ID.
- Enter the User ID and pick a Variation from the dropdown.
- Repeat for more users.
- Click Save.
Pinned user IDs always see their assigned variation — they bypass audience filters and weight allocation.
You can edit pinned users on Draft tests (before launch) and on Running tests.
Pinned test users are not surfaced on the test pageThe test detail page doesn't show that there are pinned users — you only see them when you open Manage test users. Plan accordingly during QA reviews.
Paywall snapshots
Paywalls used as test variations are copied and frozen at launch. The test keeps its own snapshot of each variation's paywall.
- Editing the original paywall in Product Hub doesn't change what the test serves.
- Deleting the original paywall doesn't affect the test — variations keep serving the snapshot.
- Product set, product order, and Custom JSON are frozen.
The Control variation always uses the live paywall that the Targeting currently serves — it's not a snapshot. Editing the Targeting's default paywall mid-test will update what Control variation users see.
Paywall Screens render the frozen product set but pull the live UI from Figma. You're responsible for keeping the Figma file unchanged during the test.
App remote config
App remote config is a JSON parameter object delivered to the SDK alongside paywalls. You can A/B test it as a separate asset.
In a test variation, write the JSON the SDK will receive for users assigned to that variation. Your app code reads the values and varies behavior — onboarding length, feature flags, copy strings, anything you map.
- The Control variation uses the Targeting's current app remote config (or no config if none is set).
- Each test variation uses its own JSON defined in the variation tab.
Test priority and user reallocation
You can run multiple A/B tests at the same time — one Running test per Targeting. The SDK picks the variation for a given user based on Targeting rank.
- When a new A/B test is launched on a Targeting, that Targeting moves to the top of the rank. The most recently launched test always wins for overlapping audiences.
- When the test is completed, the Targeting returns to its original rank position.
If a user is currently in test A1 on a broader Targeting and a higher-priority test A2 is launched on a narrower Targeting they also match, the user is reallocated to A2 immediately. Revenue and events that already happened in A1 stay attributed to A1; everything new is attributed to A2.
If A2 is later completed and A1 is still Running, the user returns to A1.
Complete and evaluate
When you're confident in a variation, click Complete A/B test on the Running test detail page.
The Complete modal shows preliminary indicators per variation: View to Purchase, Trial Conversion, ARPU, ARPPU. Each variation also shows Effect (% change vs Control) and P-value (statistical significance). For metric definitions and significance rules, see Analyzing Experiments.
You must check I'm sure I want to complete the A/B test to confirm. The button stays disabled otherwise.
Don't complete based on borderline P-valuesA result is significant only when P-value ≤ 0.05. Don't complete the test while the P-value is just above the threshold — borderline results are too uncertain to act on. Either wait for more data or accept that the test is inconclusive.
After completion:
- Users who were in the test stay assigned to their variation — they keep seeing the variation's paywall and their revenue keeps flowing to the test.
- Users newly matching the Targeting follow the normal Targeting rank — they go to the next matching Targeting.
- The Targeting returns to its original rank position (see Test priority).
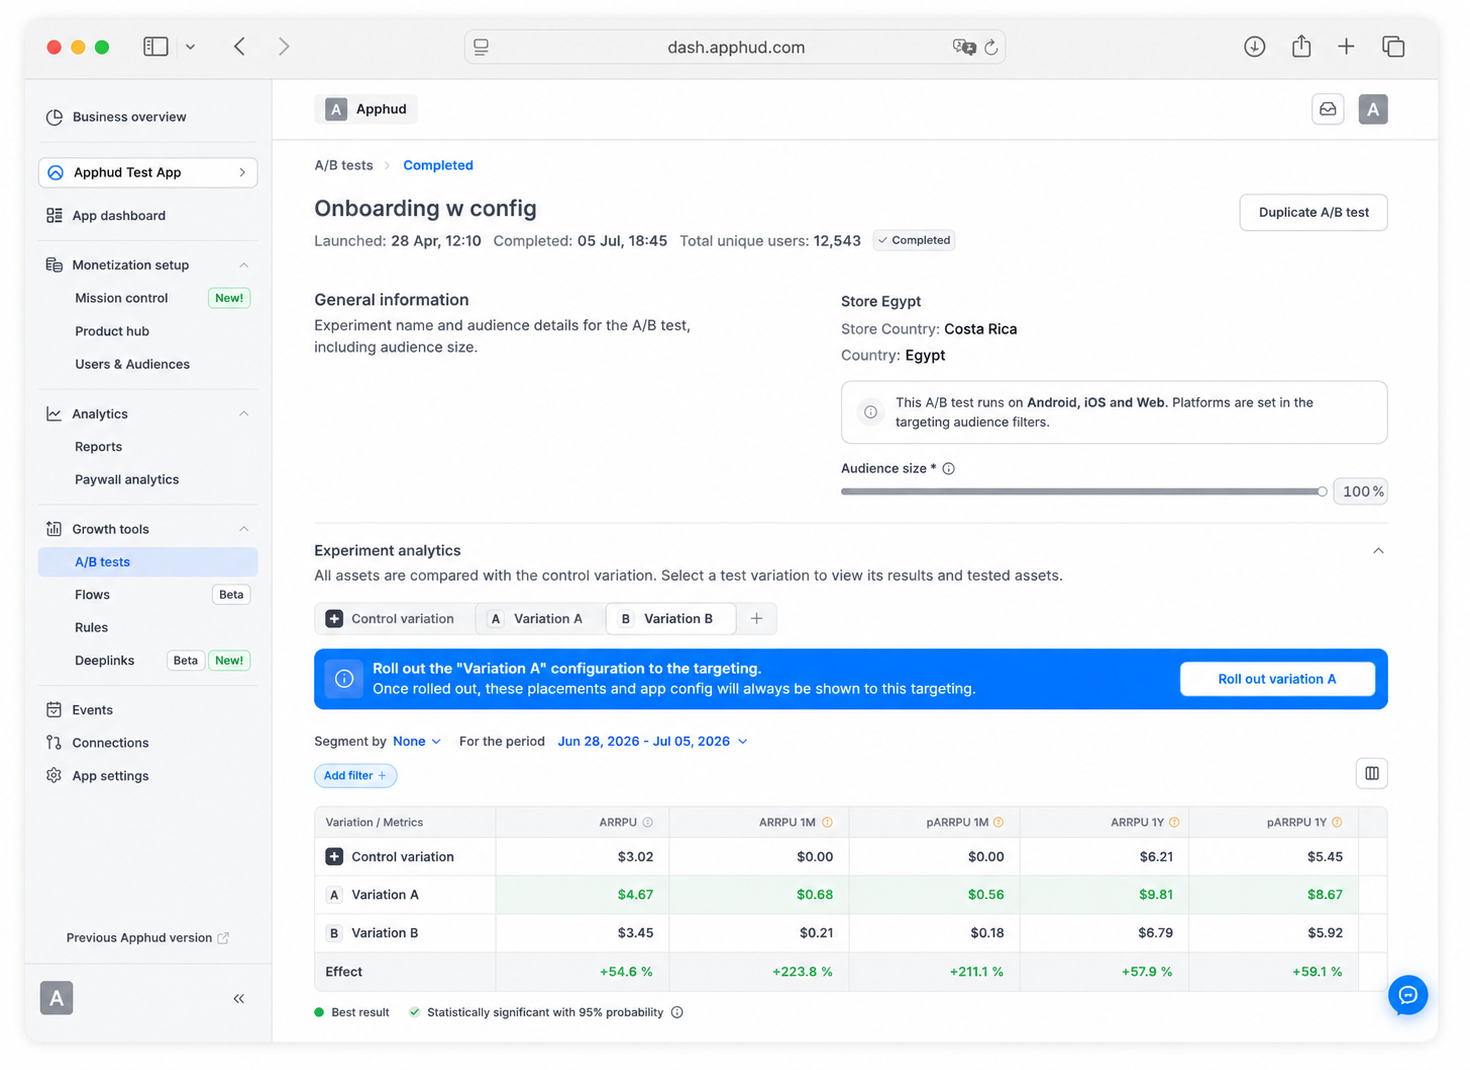
Roll out the winning variation
Once a Completed test has a clear winner, you can apply that variation's assets to the test's Targeting permanently. From then on, every user matching the Targeting gets the winning paywall(s) and App remote config as the new default.
Available on Completed tests only. To roll out, you must first Complete the test.
How to roll out
-
Open the Completed test's detail page.
-
Scroll to Experiment analytics. The default view shows the Control variation tab. While on Control, you'll see a hint:
Select your winner variation to roll out it's results to the targeting.
-
Click the test variation you want to roll out (Variation A / B / etc.). A blue banner appears:
Roll out the "Variation X" configuration to the targeting. Once rolled out, these placements and app config will always be shown to this targeting.
On the right of the banner: Roll out variation X button.
-
Click the button. A confirmation modal opens:
Roll out the "Variation X" configuration to the targeting? Placements and app remote config from "Variation X" will be applied to "{targeting name}" targeting.
This action cannot be reverted.
-
Click Roll out to confirm. The variation's paywall(s) and App remote config replace the Targeting's current configuration for the corresponding assets.
What roll-out does
-
Every placement in the variation overwrites the Targeting's paywall for that placement (e.g., if
placement_mainwas usingpaywall_Aand the variation set it topaywall_B, the Targeting now servespaywall_B). -
The variation's App remote config (if any) becomes the Targeting's App remote config.
-
The change is irreversible — undo means manually re-configuring the Targeting back to the old assets via Mission Control → Targetings.
-
After roll-out, the variation tab shows a confirmation badge:
Variation X assets have been applied to the targeting.
The Audience size area also shows: "You've applied assets from Variation X to this audience."
You can only roll out one variation per testEach test variation has its own Roll out button, but the action is permanent — once you've rolled out Variation A, you can't go back and roll out Variation B from the same test. Pick the winner deliberately.
Duplicate a test
Available on Running and Completed tests via Duplicate A/B test.
Duplicate opens the targeting picker again — you must pick a Targeting (you can re-pick the same one).
- Control variation uses the new Targeting's current setup for the tested assets (paywall per placement, app remote config).
- Test variations carry over from the source test — paywalls, products, Custom JSON, app remote config.
- Paywalls in test variations are snapshotted again at the moment you Run the duplicate.
Using A/B tests in Observer Mode
You can use A/B tests on paywalls and App remote config even in Observer Mode. If you don't use Apphud SDK to make purchases, you need to tell Apphud which paywall (and optionally which placement) was used when the purchase happened — otherwise the SDK can't attribute the purchase to the right test / variation.
iOS — call willPurchaseProductFrom before the purchase:
Apphud.willPurchaseProductFrom(paywallIdentifier: "paywallID", placementIdentifier: "placementID")
YourClass.purchase(product) { result in
    ...
}
Android — call trackPurchase after a successful purchase, passing both identifiers:
Apphud.trackPurchase(
    purchase: Purchase,
    productDetails: ProductDetails,
    offerIdToken: String?,
    paywallIdentifier: String? = null,
    placementIdentifier: String? = null
)
FAQ
If a user already has an active subscription and matches the Targeting, will they enter the test?
Any user who matches the Targeting is assigned to a variation when they launch the app, including users with active subscriptions. The subscription status is not checked at assignment time — only the Targeting's audience conditions.
If you don't want subscribers in the test, either:
- Add an extra audience condition on the Targeting like "In-app subscription status is not active", or
- Keep the Targeting broad and gate paywall display in your app code (only show the paywall if there's no active subscription).
Subscribed users will still count as part of the test audience (in the Users metric), but they'll never see the tested paywall. That's why experiment analytics may show more Users than Unique Views — conversions are calculated from Views, not from all assigned users.
Can the same user participate in multiple A/B tests at once?
Yes, with limits.
- Different paywalls — if the tests vary different paywalls, the same user can be in both.
- Same paywall in different placements — different placements are independent, so the user can be in both tests.
- Same paywall + same placement — only one A/B test at a time per paywall + placement pair for a given user.
What happens when a test on the user's Targeting completes — do they stay in or leave?
Users who were in the test stay assigned to their variation and keep seeing it. The Targeting returns to its original rank position, so newly matching users follow the normal rank order (next matching Targeting wins).
If a higher-priority test launches on a narrower Targeting the user also matches, do they move?
Yes. The user is reallocated to the higher-priority test immediately. Revenue and events from before the move stay attributed to the original test. New events go to the new test.
If the higher-priority test later completes and the original test is still Running, the user returns to the original.
What if a user no longer matches the Targeting (e.g., they updated the app version)?
The user stays in the test as long as it's Running. App version updates, country changes, etc. don't kick them out mid-test. Only completing or stopping the test removes the assignment.
I set audience size to 100% New Users but in Test Mode I see the variation on a device that already has the app installed. Why?
Test Mode ignores audience filters and user history. Any sandbox user gets allocated to the chosen variation at 100%. Test Mode is for verifying paywalls render correctly, not for testing user-split rules.
Why don't my sandbox purchases show in the experiment metrics?
Sandbox transactions are excluded from all aggregated analytics in Apphud — experiment metrics, charts, and the Total Spent field. Only production users contribute to metrics. Sandbox purchases still appear in the user's event timeline for testing purposes.
Why isn't user distribution exactly 50/50?
The assignment algorithm doesn't alternate users strictly. It applies internal balancing for statistical integrity. Early distribution may look uneven (e.g., 140/112) — proportions even out with sample size. A perfectly equal split is not required and not expected.
I edited a paywall used in a Running test. Did it affect the test?
No. Paywalls used as test variations are snapshotted at launch. Editing the original in Product Hub doesn't change what the test serves. The Control variation, however, uses the live paywall the Targeting serves — so editing the Targeting's default paywall does affect Control.
For details, see Paywall snapshots.
Can I edit or delete a paywall product that's used in a Running test?
- Edit the paywall — yes, but it doesn't affect the test (snapshot).
- Delete the paywall — yes; the test keeps serving the snapshot.
- Delete a product used by the paywall — no. The product can't be deleted while the test is Running.
Can I delete a placement used in a Running test?
Yes, with a warning. The UI confirms that the placement will disappear from all Targetings, including the test's. The test keeps Running on the remaining placements.
The Events page shows Paywall shown for the target paywall but it doesn't match the test's Unique Views. Why?
Several reasons:
- Repeated opens — a single user can trigger Paywall shown multiple times. Events counts all of them; Unique Views counts users.
- Data delay — experiment metrics update with a delay (up to ~1 hour) compared to raw events.
- Events before the test launched — same-day events that occurred before the launch appear in Events but not in test metrics.
- Background sessions — users who launched the app before the test started and kept it in the background are not assigned to the test. Their Paywall shown events on the target paywall appear in Events but not in the test.
Assignment happens at app launch, not when the app returns from background.
What's the difference between Completing a test and Rolling out a variation?
- Complete finalizes the test — no more users get allocated to variations; users already in the test stay assigned. The Targeting's underlying configuration doesn't change.
- Roll out writes the winning variation's paywall(s) and App remote config into the Targeting itself. From then on, the Targeting serves those assets to everyone matching it. Roll-out is irreversible and only available on Completed tests.
Standard workflow: Complete the test → review the winner → Roll out → optionally Duplicate to start the next test.
Can I roll out a variation, see it's not working, and roll out a different variation from the same test?
No. Roll-out is a one-way action per test. If you've rolled out Variation A and want a different configuration, edit the Targeting manually in Mission Control → Targetings or run a new test with Variation B's setup.
Can I assign a user to the test based on an in-app action (e.g., closing the onboarding paywall), not at launch?
Yes, but it requires app-side setup. The pattern:
- Define a custom user property (e.g.,
first_paywall_closed). - Create a custom audience on a Targeting using that property.
- Set up the A/B test on that Targeting.
- In your app, set the property when the action happens and flush it immediately.
- Refresh the user data and fetch placements after flushing.
Apphud.setUserProperty(key: .init("first_paywall_closed"), value: true)
Apphud.forceFlushUserProperties { _ in
    Apphud.refreshUserData { _ in
        Apphud.fetchPlacements { placements, _ in
            // placements are refreshed
        }
    }
}
See User Properties and Audiences for full details.
Updated 26 days ago