
Sales
Total amount billed to customers after deducting refunds, before taxes and store commission.
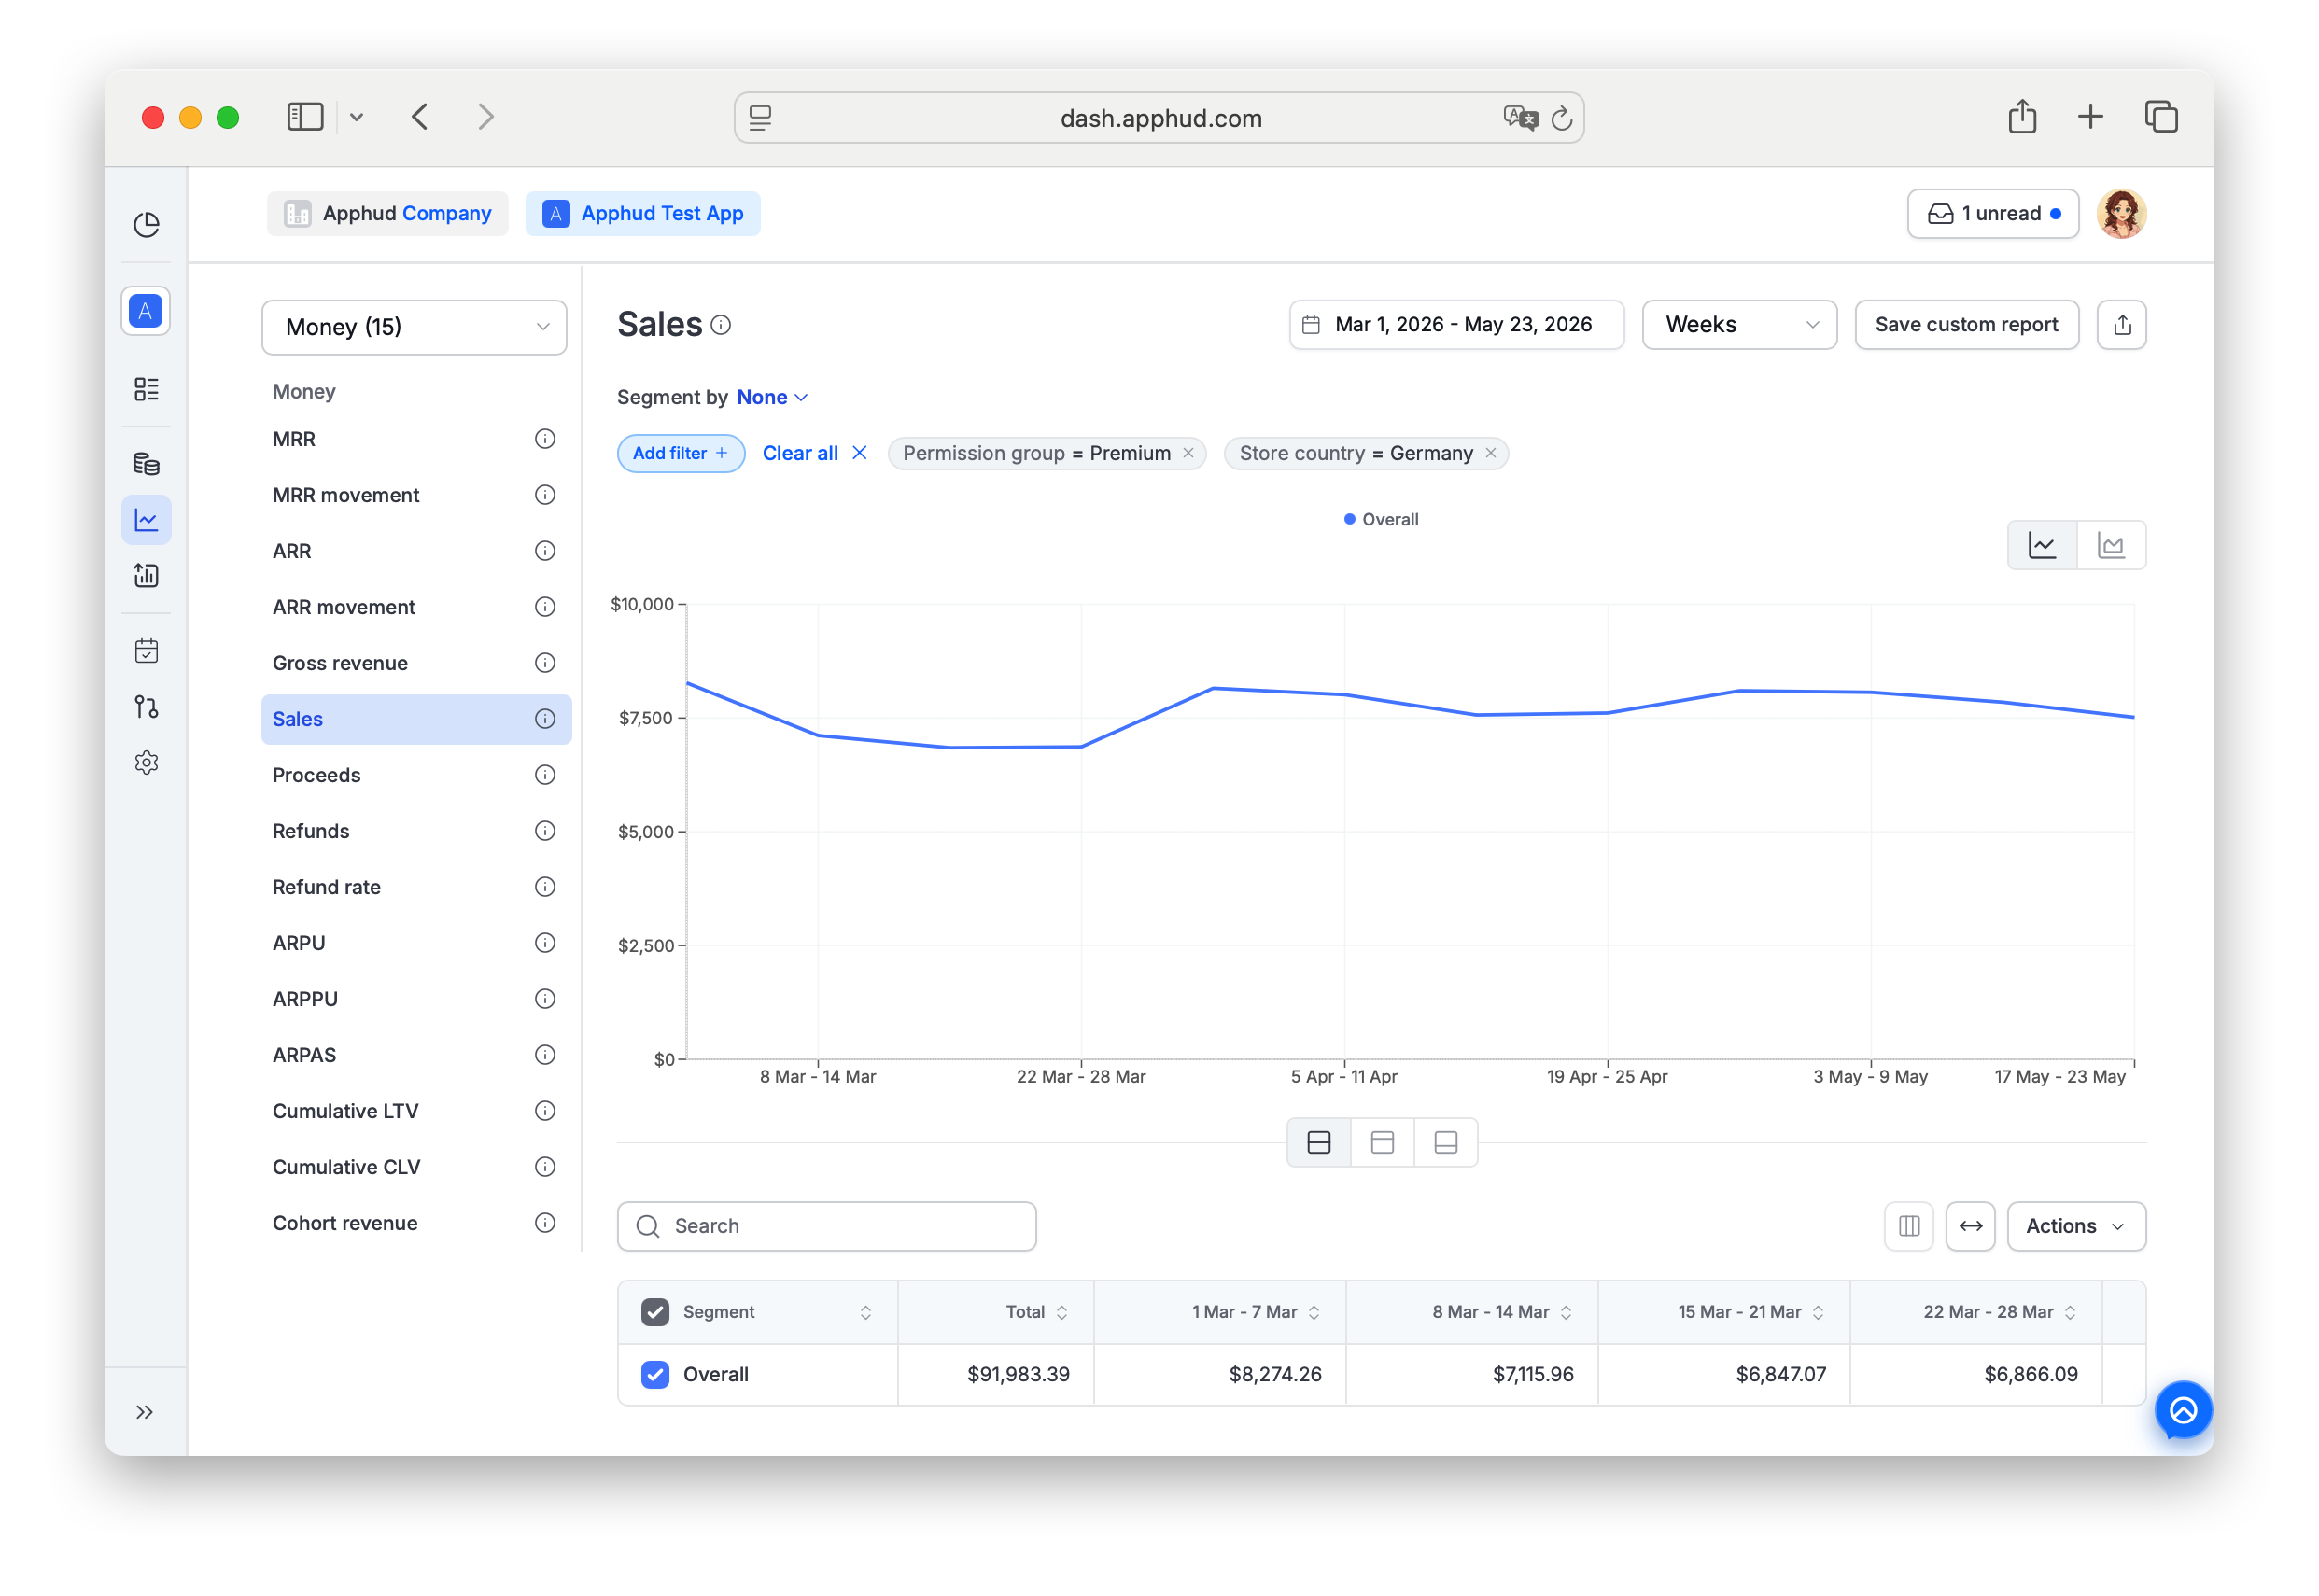
Sales is a non-cohort chart that indicates the total amount billed to customers for purchasing subscriptions and non-renewing purchases, after deducting refunds, but before store commission and taxes.
Find Sales under Analytics → Reports → Money in the sidebar.
What's included
Sales = Gross revenue − Refunds.
It is the "billed-net-of-returns" amount:
- New subscription purchases and renewals — counted at the billed amount
- Non-renewing purchases — counted at the billed amount
- Refunds — deducted from the period in which they occur
Sales is not reduced by:
- Store commission (15% or 30%, not yet deducted)
- VAT (not yet deducted)
For the gross-billed version (before refunds) see Gross revenue. For the after-everything version (commission + VAT deducted) see Proceeds.
Gross revenue ≥ Sales ≥ Proceeds
Revenue Type segment
Sales supports a chart-specific Revenue Type segment that splits the chart into three sub-series:
- New revenue — first-time purchases (initial subscriptions, intro offers, reactivations after expiration, non-renewing purchases)
- Renewals — recurring renewal charges on existing subscriptions
- Refunds — refund amounts (negative)
Use it to see how much of Sales is recurring vs. acquisition vs. refund drag.
Supported filters and segments
Sales supports all standard segments and filters documented in Reports → Filters and segments, plus the Revenue Type segment described above.
Filter-only (not available as Segment by):
- Permission group — segment support is planned, currently filter only.
- Screen
- Experiment variations
NoteThe Install Time segment (First seen week / First seen month) is especially useful here — break the chart into install-cohort lines or stacks to see how each acquisition cohort's revenue evolves. See Reports → Install Time.
FAQ
How is Sales different from Gross revenue and Proceeds?
| Metric | Includes refunds? | Includes commission? | Includes VAT? |
|---|---|---|---|
| Gross revenue | Yes (counted as billed) | Yes (not deducted) | Yes (not deducted) |
| Sales | Refunds deducted | Yes (not deducted) | Yes (not deducted) |
| Proceeds | Refunds deducted | Commission deducted | VAT deducted |
When a user requests a refund, when does Sales reflect it?
Sales is reduced in the period the refund is processed, not in the period the original purchase occurred. This can cause Sales for the current period to drop unexpectedly if many refunds land at once. See Proceeds → Why might historical proceeds change? for the related historical-recalculation behavior.
Can I see what's behind a Sales drop?
Yes — segment by Revenue Type to split Sales into New revenue, Renewals, and Refunds. A big Sales drop with stable New revenue and Renewals usually means refunds spiked.
Why is this chart non-cohort?
Sales is plotted on the transaction date, not on the user's first-seen date. A renewal or refund on a user's day 200 shows up on the date of the charge, not on the cohort the user belongs to.
Why did historical totals shift after the period closed?
Two main causes: late-arriving store server notifications (renewals, refunds), and refunds processed retroactively against earlier transactions. See About Analytics → Why can historical data in my charts change over time?.
Updated 13 days ago