
Average Revenues
Average revenue across user segments — installs, downloads, trials, conversions, subscriptions, reactivations.
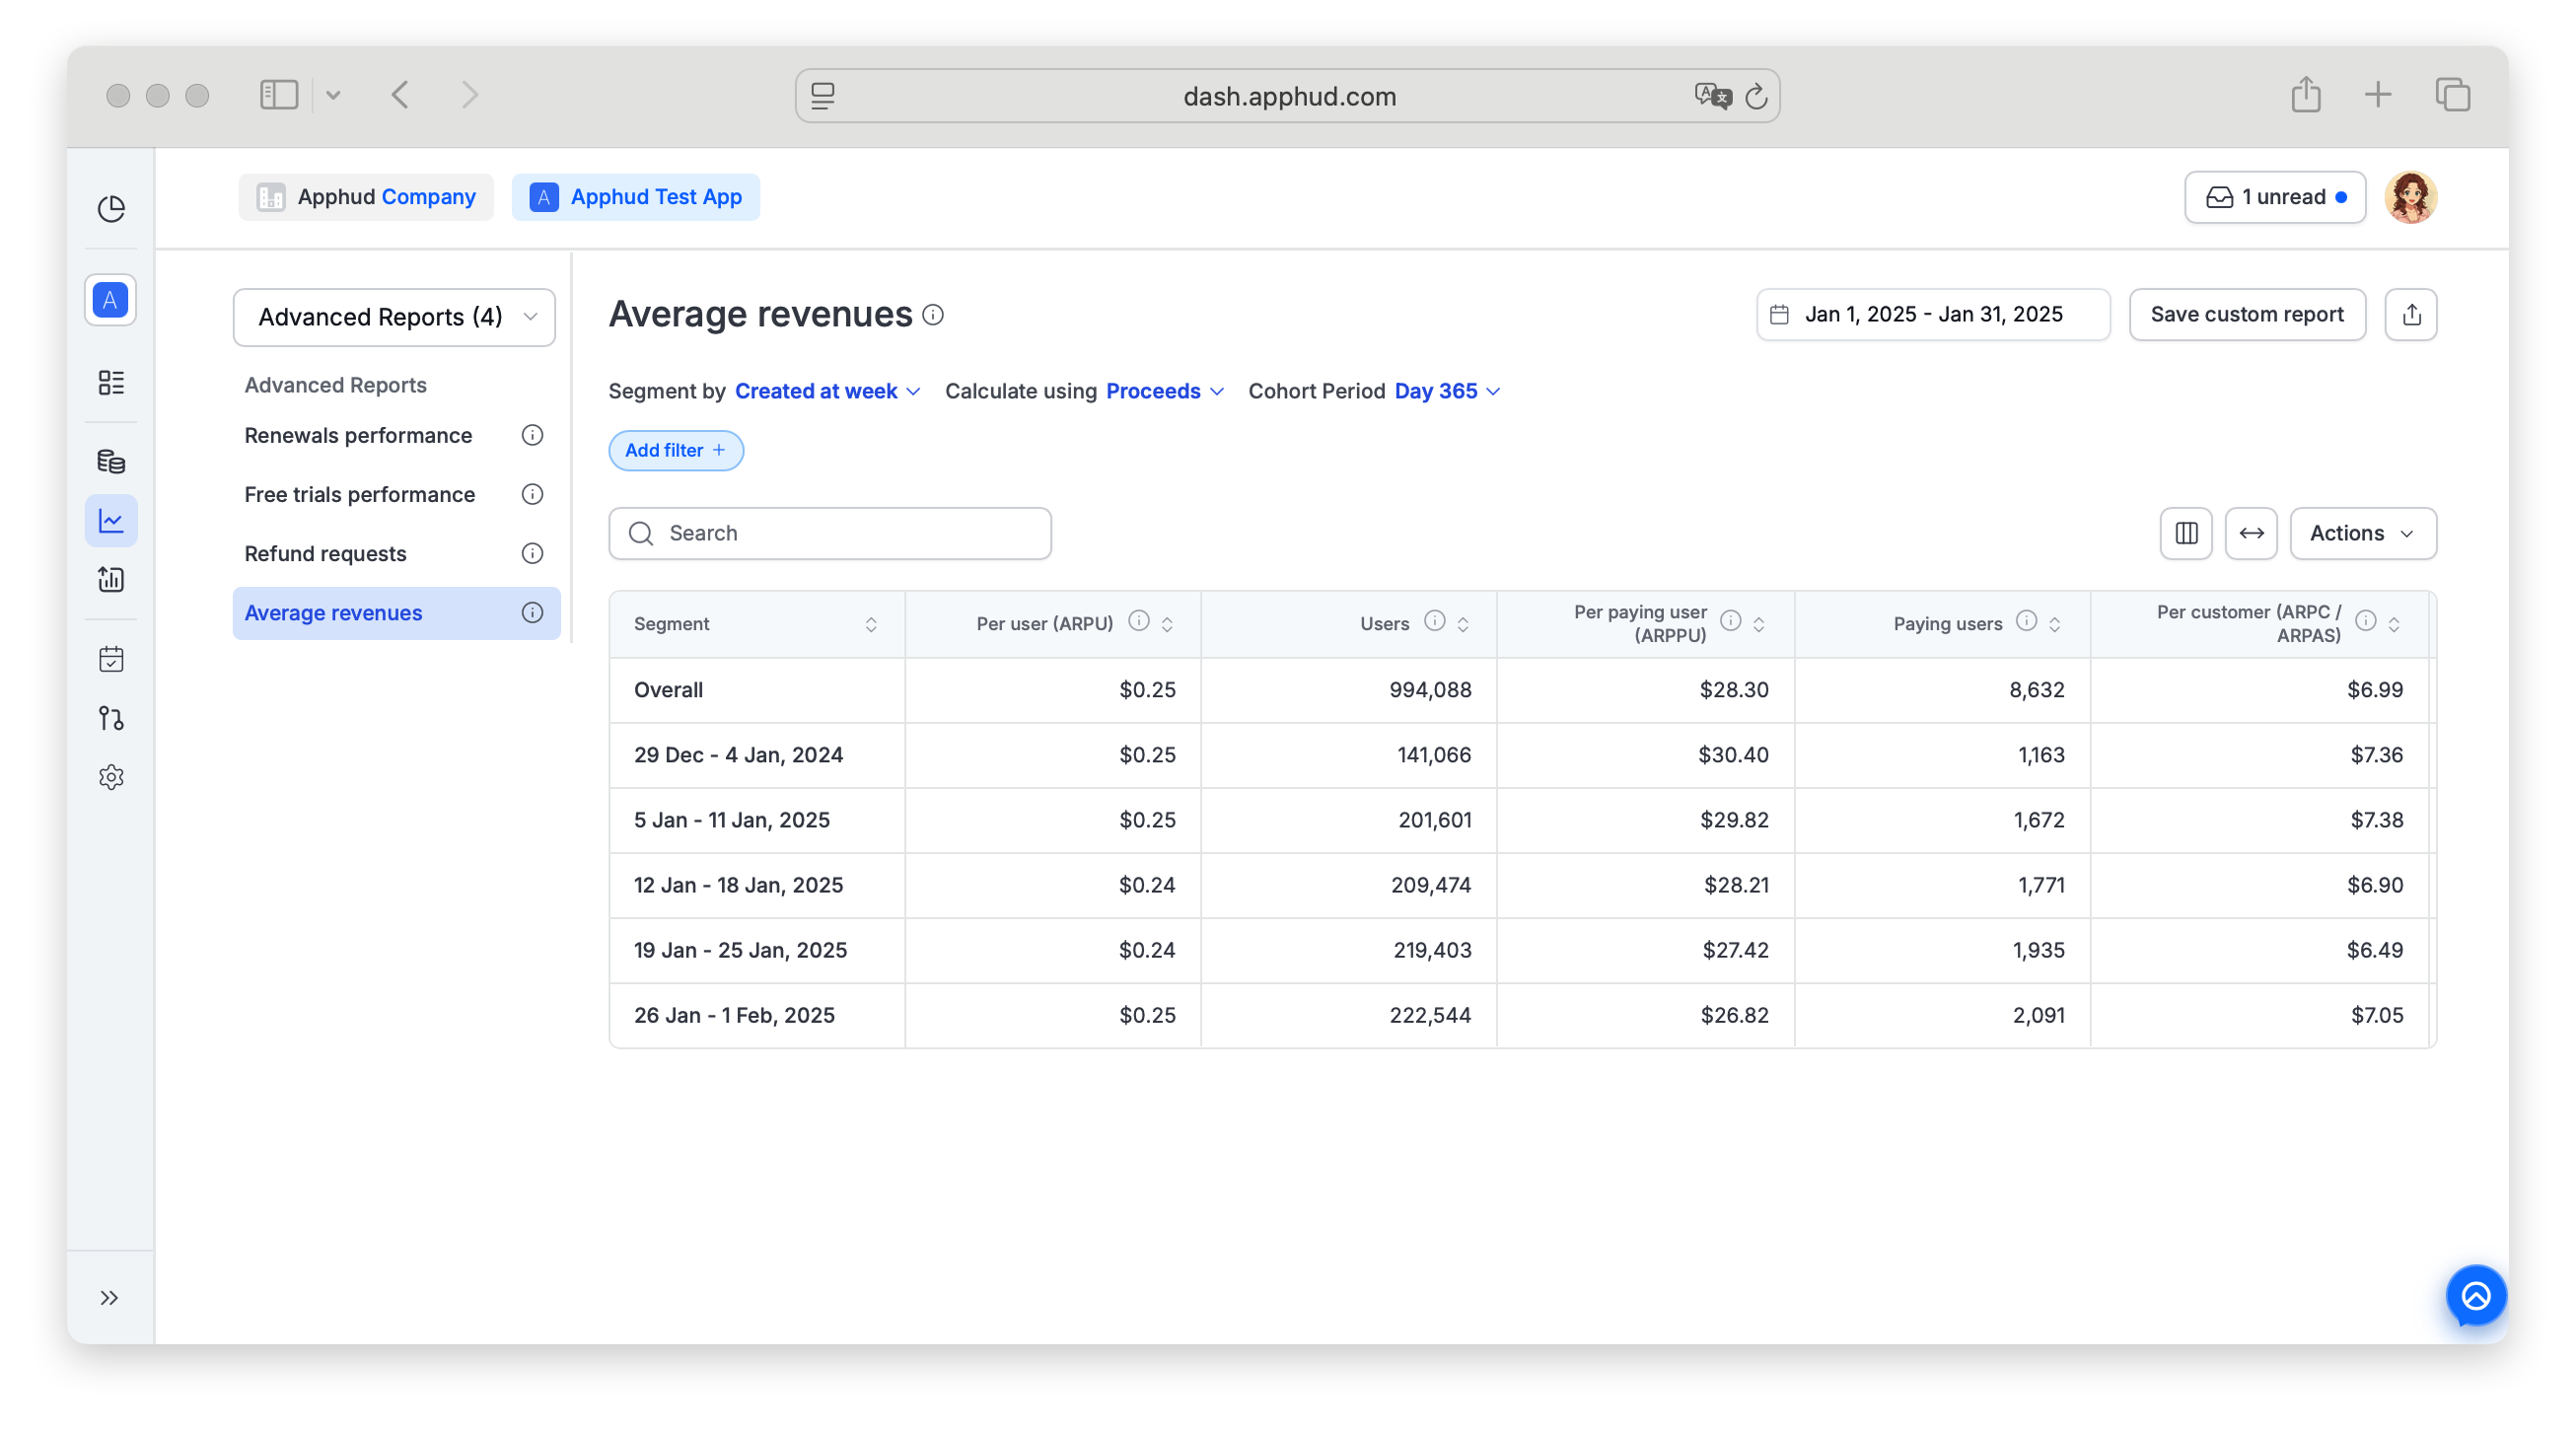
Average Revenues Report provides a detailed overview of average revenue generation across different user segments and app interactions. It surfaces 20+ average-revenue metrics — per user, per paying user, per customer, per trial subscriber, per download, per subscription, per subscription activation, and per reactivation — in one place.
Use it to compare monetization efficiency across cohort definitions, and to model the lifetime value of reinstalls separately from original installs.
Find Average Revenues under Analytics → Reports → Advanced Reports in the sidebar.
Usage
This report is a valuable tool for assessing revenue trends and optimizing monetization strategies. By examining the metrics below, you can refine pricing, improve retention, and allocate marketing resources more effectively.
Understanding reinstall purchase behavior also lets you estimate the potential ROI of user re-engagement campaigns — including users who reinstalled but haven't yet paid — so you can forecast both revenue potential and the cost of winning them back.
Data availability
Data for this report is available starting from August 10, 2024.
The selected date range applies to most cohort-anchoring metrics — see Metrics below for which date each one uses. Segments like "Created on day / week / month / quarter / year" apply to the cohort-defining date of the metric you're looking at.
Platform support
iOS, Android, and Web are all supported. iOS-only metrics (due to platform specs):
- Subscription Activations + Per Subscription Activation
- Subscription Reactivations + Per Subscription Reactivation
Chart-specific parameters
Calculate using
- Proceeds (default) — average revenue after refunds, store commissions, and VAT.
- Sales — average revenue after refunds, before commissions and VAT.
Cohort Period
Default: Max (no limit). Available options:
| Option | What it counts |
|---|---|
| Day 3 | Revenue through day 3 of each user's life. |
| Day 7 | Revenue through day 7. |
| Day 30 | Revenue through day 30. |
| Day 180 | Revenue through day 180. |
| Day 365 | Revenue through day 365. |
| Enter a value | Opens a popup where you type a custom number of days. |
- Day 0 = the first 24 hours after install.
- Day 1 = the next 24 hours, and so on.
Day 0 is defined per the cohort-anchoring date of each metric — see Metrics below. For per-paying-user metrics, Day 0 = 24 hours from First Seen. For per-trial metrics, Day 0 = 24 hours from trial start. Etc.
Metrics
22 total. Toggle visibility from the columns menu.
By install pool
- Per User (ARPU) — average revenue per user who first installed in the period. Same calculation as the ARPU chart.
- Users — count of those first-time installers.
- Per Paying User (ARPPU) — same as the ARPPU chart.
- Paying Users — count of those paying users.
- Per Customer (ARPC / ARPAS) — same as the ARPAS chart.
- Customers — count of paying users + free-trial subscribers from the install cohort.
By trial activity
- Per Trial Subscriber (Trial LTV) — average revenue per user who started a free trial in the period.
- Trial Subscribers — count of those trial starters.
- Per Trial Converted Subscriber — average revenue per user who converted from trial to paid in the period.
- Trial Converted Subscribers — count of those converters.
By download type
- Per Download (ARPD) — average revenue across all downloads (first installs + redownloads).
- Downloads — count of initial installs + redownloads.
- Per Paying Download — average revenue across paying downloads. Revenue from auto-renewable subscriptions is attributed to the install or redownload at which the transaction occurred.
- Paying Downloads — count of paying downloads.
- Per Redownload — average revenue across redownloads.
- Redownloads — count of redownloads.
By subscription event
- Per Subscription — average revenue per auto-renewable subscription (paid or free trial) started in the period.
- Subscriptions — count of subscriptions purchased.
Activation / reactivation (iOS only)
- Per Subscription Activation — average revenue per initial or reactivated subscription segment. A subscription segment is a continuous sequence of transactions; it resets when a user re-subscribes after expiration. Billing issues and product-plan changes don't reset.
- Subscription Activations — count of initial purchases + reactivations.
- Per Subscription Reactivation — average revenue per reactivation only (excludes initial subscription segment).
- Subscription Reactivations — count of reactivations.
Why these metrics use different cohort datesARPU and similar use First Seen date. Trial metrics use Trial Started date. Subscription Activation metrics use the activation event date. The "Created on..." segment honors the right date per metric — don't assume one date applies everywhere.
Supported filters and segments
Average Revenues supports all standard segments and filters documented in Reports → Filters and segments. Most useful: Product and Store Country. You can nest two segments and apply multiple filters.
Filter-only (not available as Segment by):
- Permission group — segment support is planned, currently filter only.
- Screen
- Experiment variations
Learn moreCheck use cases on hidden power of reinstalls and reactivations.
FAQ
Is ARPU here the same as the ARPU chart?
Yes. Both pick users by First Seen date and consider all Proceeds for the cohort up to the selected Cohort Period. Same for ARPPU and ARPAS.
A user took a trial, then upgraded to another trial product. How is this counted?
As one trial. Events tied to the upgraded transaction are ignored — the original trial is what counts.
How is revenue attributed to redownloads?
Revenue from auto-renewable subscriptions is attributed to the install event (initial or redownload) at which the transaction occurred — not always to the original installation. This matters for per-redownload metrics that try to estimate retargeting ROI.
Can I filter by acquisition source (ad network / campaign)?
Currently no — this report supports filtering by Platform, Product, and Store Country only. Standard attribution-based filters are not available here. For attribution-segmented LTV, use the Cumulative LTV chart.
Why are Subscription Activations and Reactivations iOS-only?
The subscription-segment concept (continuous transaction sequence, reset on re-subscription after expiration) requires platform-specific transaction-history APIs that Google Play doesn't expose in the same way.
Updated 15 days ago