
Cumulative LTV
Cumulative revenue per user across a cohort's lifetime, with predictions support and First / Last Cohort maturity reference.
Cumulative LTV shows cumulative (running) revenue per user as a cohort ages. The X axis is the user's day of life — Day 0 = the first day after a user appeared in Apphud (cohort anchor). The Y axis grows as the cohort spends and contributes more revenue.
Revenue reflects Proceeds — net of refunds, store commissions, and VAT.
Find Cumulative LTV under Analytics → Reports → Money in the sidebar.
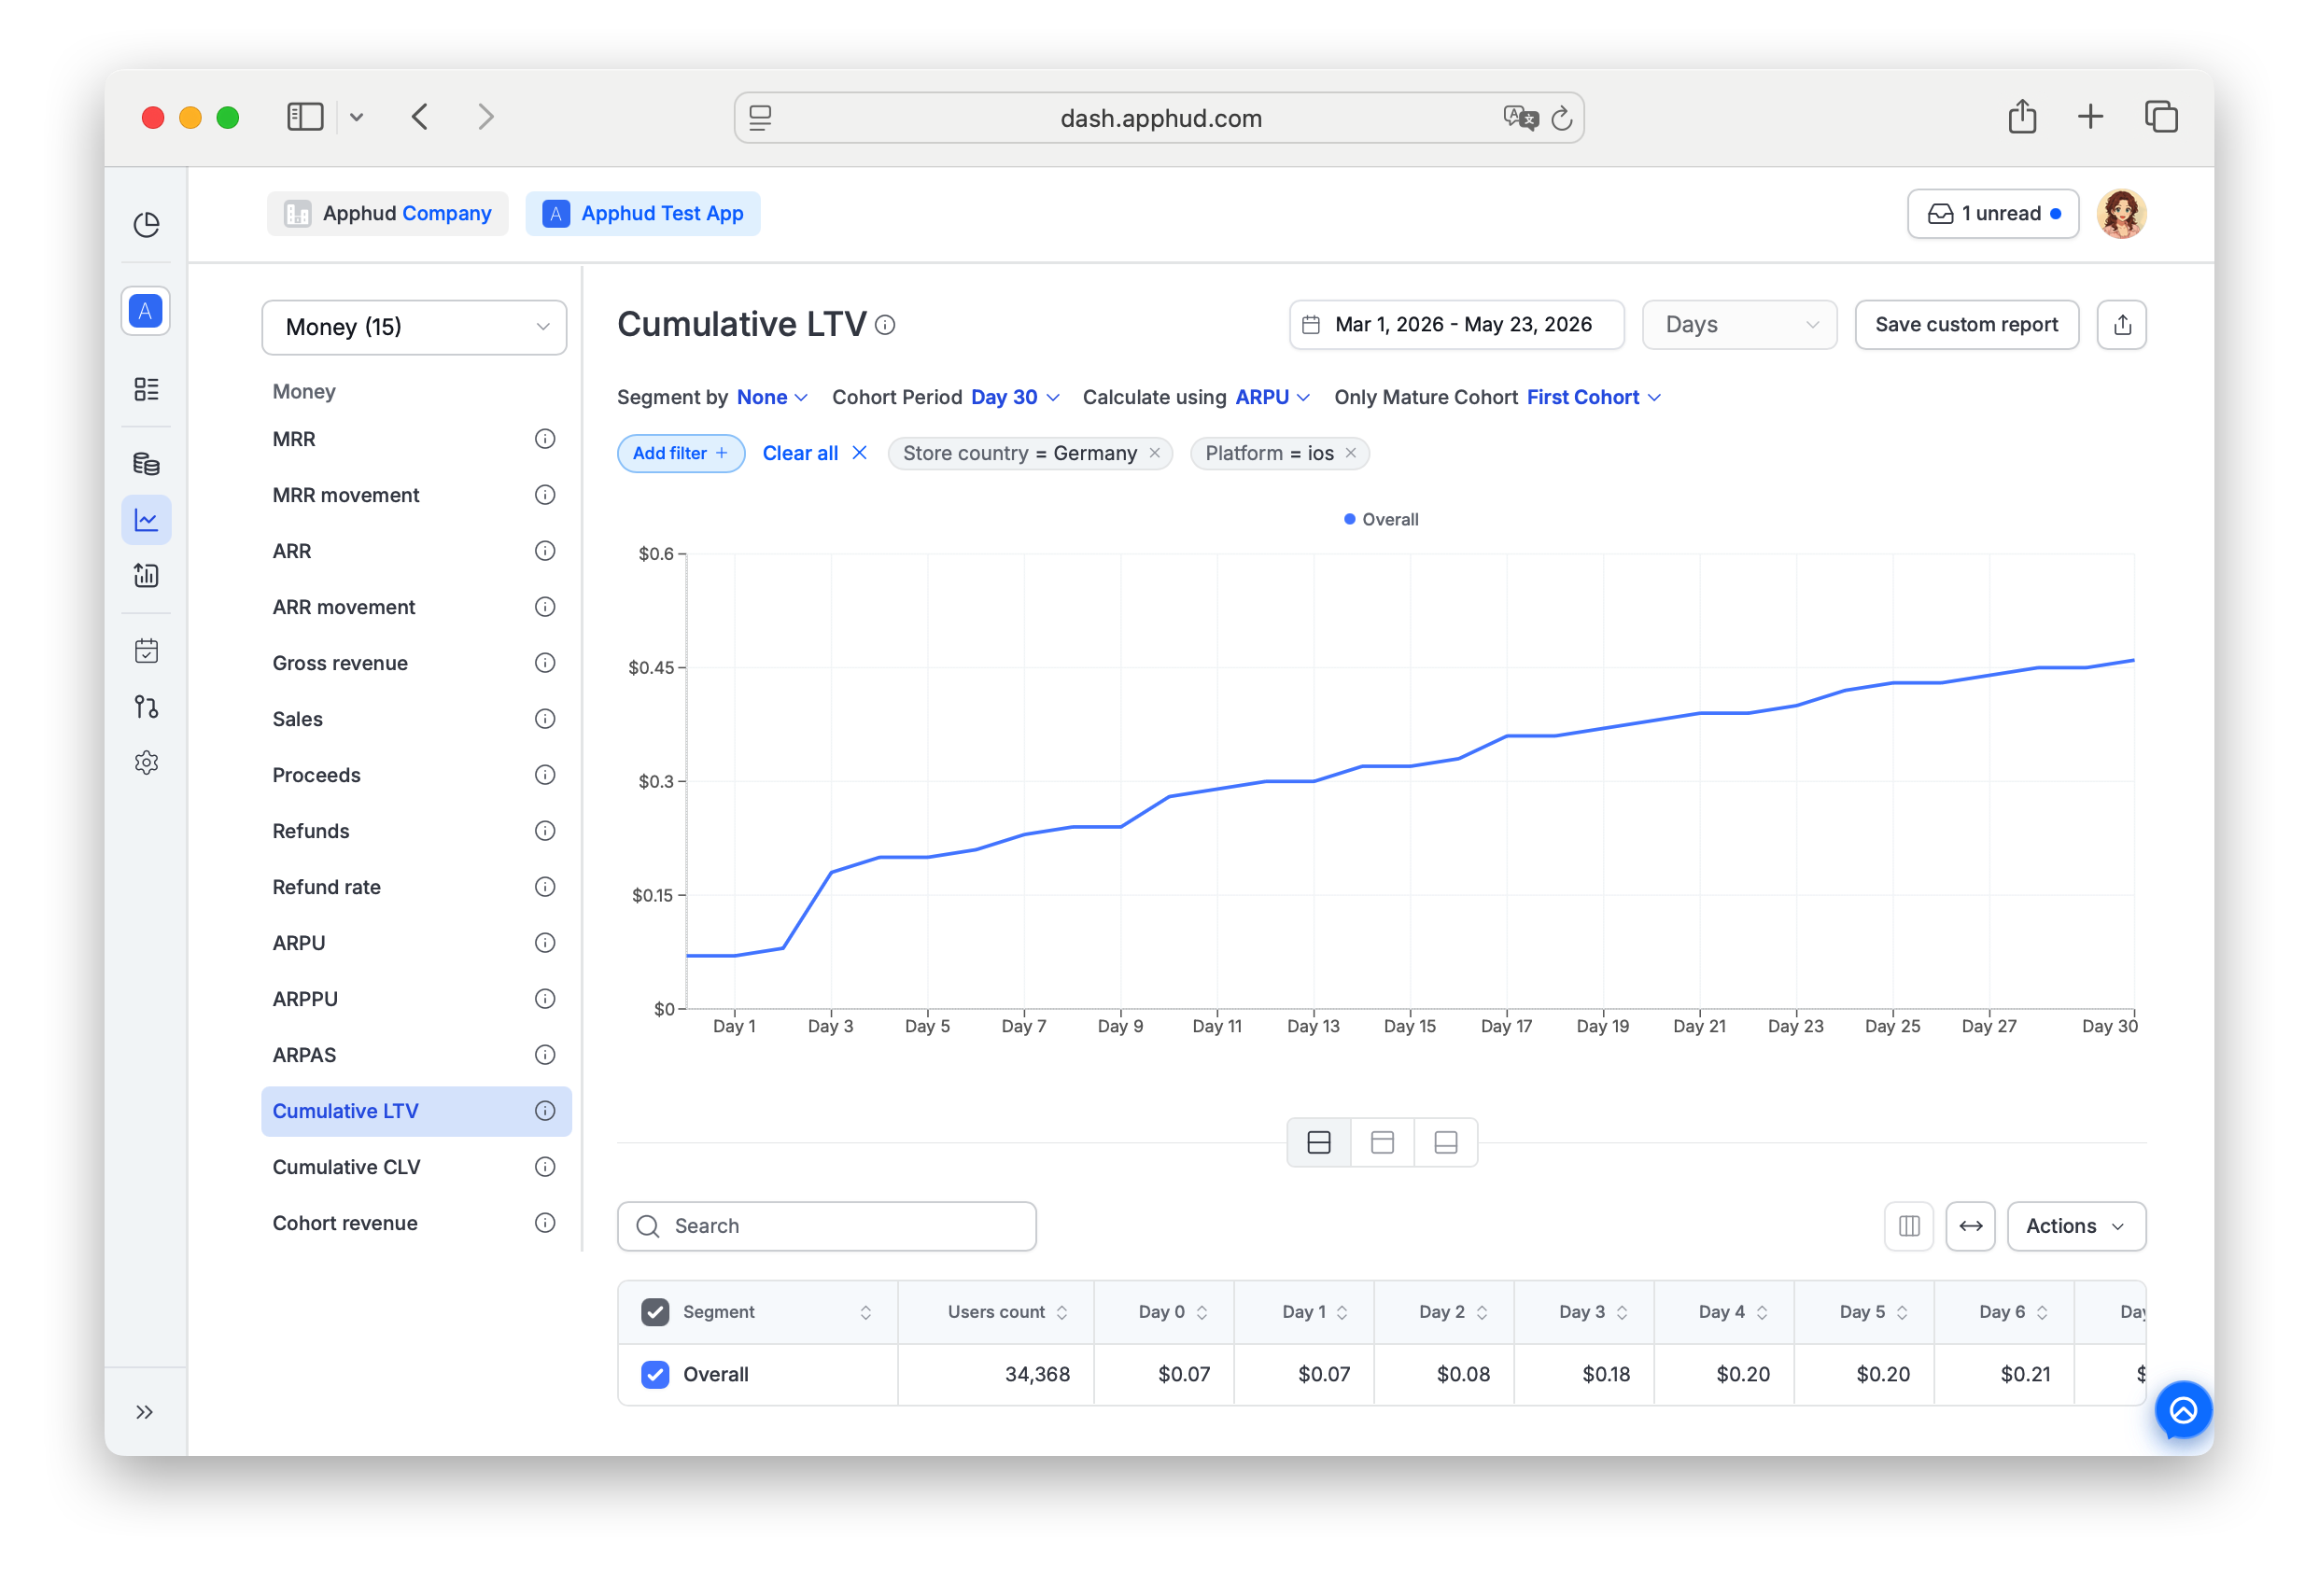
Chart-specific parameters
Cohort Period
How far into a cohort's life the chart extends along the X axis.
| Option | What it does |
|---|---|
| Day 7 | Show Day 0 through Day 7. |
| Day 180 | Show Day 0 through Day 180. |
| Day 365 | Show Day 0 through Day 365. |
| Max | No upper bound — show every day the cohort has reached. |
The actual curve length also depends on whether LTV Predictions are enabled for your app:
- Without predictions — the curve stops at the smaller of the cohort's current age and the selected Cohort Period.
- With predictions enabled — the curve always extends to the full selected Cohort Period using model-projected values for days beyond the cohort's current maturity.
Calculate using
Picks the underlying average-revenue metric the chart accumulates per day.
| Option | Denominator | What it counts |
|---|---|---|
| ARPU | All users in the cohort (installs / first-seen) | Revenue ÷ everyone, paid or not. Pessimistic — non-payers dilute the average. |
| ARPPU | Paying users only | Revenue ÷ paying users. Best for comparing monetization quality among buyers. |
| ARPAS | Active subscribers (paying users + free-trial users + zero-priced active subs) | Revenue ÷ everyone with an active subscription, including trials. |
See ARPU, ARPPU, and ARPAS for the underlying metric definitions.
Data granularity
Locked to Days — the X axis always shows day of user life. Other charts in Reports let you switch granularity; Cumulative LTV does not because its math depends on per-day cohort age.
Segment by
Standard Reports control — splits the curve into separate lines by a dimension. Cumulative LTV supports up to 2 segments simultaneously (e.g., Country × Subscription duration).
Clearable — pick None to collapse back to a single curve.
For supported segment dimensions, see Supported filters and segments below.
Predictions
This chart can show LTV Predictions for up to 365 days into the future. For more details, refer to the Predictions guide.
Only Mature Cohort
A dropdown — First Cohort or Last Cohort — that sets the maturity reference point for the curve. This is the key control that determines how much of the curve is real data vs. prediction.
What "maturity reference point" meansA cohort is "mature" up to the number of days it has actually lived. A cohort installed 30 days ago is mature only up to Day 30 — Days 31+ have no real data for all cohort members and must be partially predicted or excluded.
When your selected date range spans multiple day-cohorts (e.g., installs across a whole month), each cohort has a different maturity. The Only Mature Cohort dropdown decides which cohort's age to treat as the cutoff between "real data" and "prediction".
First Cohort
- Cutoff = the oldest cohort in the selected range — the one that has lived the most days.
- "Real data" segment of the curve extends as far as the oldest cohort has lived.
- The far end of the curve is supported only by the oldest cohorts — younger cohorts haven't reached those days yet.
- Visual signal: the tail of the curve may go flat for several days when there have been no new transactions from the oldest cohort recently. The curve can't change past the youngest cohort's age, so transactions from younger users only update earlier parts of the curve.
Use First Cohort when you want to see as much real data as possible, accepting that the late part of the curve is held up by a smaller and older sample.
Last Cohort
- Cutoff = the youngest cohort in the selected range — the one that has lived the fewest days.
- "Real data" segment extends only as far as every cohort in the range has lived (the apples-to-apples portion).
- Beyond that, the curve is a prediction.
- Visual signal: the curve typically ends at the youngest cohort's age and continues as a dashed prediction line if predictions are enabled. No flat tail.
Use Last Cohort when you want strict apples-to-apples comparison across cohorts — every point on the curve is computed from cohorts that all reached that day.
Worked example
You're viewing the March 2026 cohort on June 15, 2026.
- Oldest user (first seen March 1) is on day 106.
- Youngest user (first seen March 31) is on day 76.
With First Cohort:
- Real data runs through day 106 (the oldest cohort's age).
- Days 77–106 are supported only by users older than March 31.
- A new transaction on June 13 from a user with first seen March 28 lands on day 74 (their age that day) — it updates the curve near the start, but can't affect days 77+.
- Result: the tail of the curve sits flat at the last known value until an oldest-cohort user transacts.
With Last Cohort:
- Real data runs through day 76 only.
- Days 77+ are dashed predictions.
- No flat-tail artifact — the curve transitions cleanly from solid (actual) to dashed (predicted).
Reading the curve
- Solid line — actual cumulative revenue, computed from real transactions.
- Dashed line — predicted continuation of the curve (only when LTV Predictions are enabled).
- Reference marks at 30 / 60 / 90 / 180 / 365 — these are model checkpoints where predictions are anchored. The chart picks consistent points for comparing variations / segments at fixed payback horizons.
- Flat horizontal tail with First Cohort — see the worked example above.
Supported filters and segments
Cumulative LTV supports most standard segments and filters documented in Reports → Filters and segments.
Not supported as Segment by when Calculate using = ARPU:
- Product
- Paywall
- Base plan
The all-users ARPU denominator can't be broken down by subscription-product dimensions. Switch Calculate using to ARPPU or ARPAS to enable those segments.
Filter-only (not available as Segment by):
- Permission group — segment support planned.
- Screen
- Experiment variations
FAQ
Why does my curve flatten at the end?
You're looking at the chart with Only Mature Cohort = First Cohort, which extends real data through the oldest cohort's age. Days at the tail are supported only by your oldest users. If those users haven't transacted recently, the curve can't move — hence the flat tail.
To get a non-flat curve, switch to Last Cohort: the curve ends at the youngest cohort's age (no late-day-only-old-users problem), and beyond that you'll see a dashed prediction line.
See the worked example above for a step-by-step walk-through.
What's the difference between First Cohort and Last Cohort?
- First Cohort — anchors maturity on the oldest cohort. Longer real-data segment, but the tail leans on a shrinking sample.
- Last Cohort — anchors maturity on the youngest cohort. Shorter real-data segment, but every point is apples-to-apples.
Use Last Cohort for clean comparisons (e.g., comparing two segments fairly). Use First Cohort when you want to see all real data and don't mind the late part being driven by older cohorts.
What's the difference between Cumulative LTV and Cumulative CLV?
- Cumulative LTV — cohort anchor is install / first seen. Day 0 = the day Apphud first saw the user.
- Cumulative CLV — cohort anchor is first purchase. Day 0 = the day the user first paid.
LTV starts the clock at user acquisition. CLV starts the clock at user monetization.
How are refunds handled?
Refunds reduce a cohort's cumulative revenue retroactively at the day they're processed. The curve can flatten or dip when many refunds land in a single window. This is expected — Cumulative LTV is meant to reflect realized value, not gross sales.
Why are predictions only visible when LTV Predictions are enabled?
Predictions require a trained model on your app's historical data. Enable LTV Predictions on the app's App settings → LTV predictions banner (Expert plan and above). After 24 hours of training, the dashed line and reference checkpoints appear automatically. See Predictions for full details.
Can I segment Cumulative LTV by Product when Calculate using = ARPU?
No. ARPU's denominator includes users who never bought anything — there's no way to attribute them to a specific Product. Switch Calculate using to ARPPU (paying users) or ARPAS (active subscribers) to segment by Product, Paywall, or Base plan.
Why doesn't the X axis show calendar dates?
Cumulative LTV plots day of cohort life, not calendar time. Two cohorts installed in different weeks both start at Day 0 on the chart and are compared on equal footing. Switch to other charts (e.g., MRR) for calendar-time views.
How does Cumulative LTV relate to ARPU / ARPPU / ARPAS?
Cumulative LTV is the time-series view of those same averages:
- Calculate using = ARPU → the curve is cumulative ARPU per day of cohort life.
- Calculate using = ARPPU → cumulative ARPPU per day (paying users only — close in concept to Cumulative CLV, which is anchored on first-purchase date instead of install).
- Calculate using = ARPAS → cumulative ARPAS per day (includes free-trial users in the denominator).
The single-number charts (ARPU, ARPPU, ARPAS) tell you "by Day N". Cumulative LTV plots the whole curve from Day 0 to Day N.
Should I look at Cumulative LTV for my whole app history or for my campaign's cohort?
Use the cohort that matches your decision:
- For "did my May ad spend pay back?" — set the date range to your May install cohort and look at that cohort's curve.
- For "what does a typical user generate over time?" — use a longer range; the curve smooths over individual cohort variation.
All-time numbers can be more stable but answer a different question than per-campaign payback. The mature-cohort dropdown (First Cohort / Last Cohort) controls how the date range collapses into the curve — pick Last Cohort for strict apples-to-apples comparison across cohorts.
Is the First Cohort / Last Cohort dropdown the same thing as "Only mature cohorts"?
Yes — it's the same concept, with a clearer control. In earlier versions it was a single Only mature cohorts toggle:
- ON ≈ today's Last Cohort — only days every cohort has lived through.
- OFF ≈ today's First Cohort — extends to days only the oldest cohort has lived.
The First / Last dropdown is more explicit about which cohort anchors the maturity cutoff. See Only Mature Cohort for details.
Updated 20 days ago