
Predictions
LTV Predictions — forecast future revenue per user cohort. Self-serve activation in App settings on Expert+ plans.
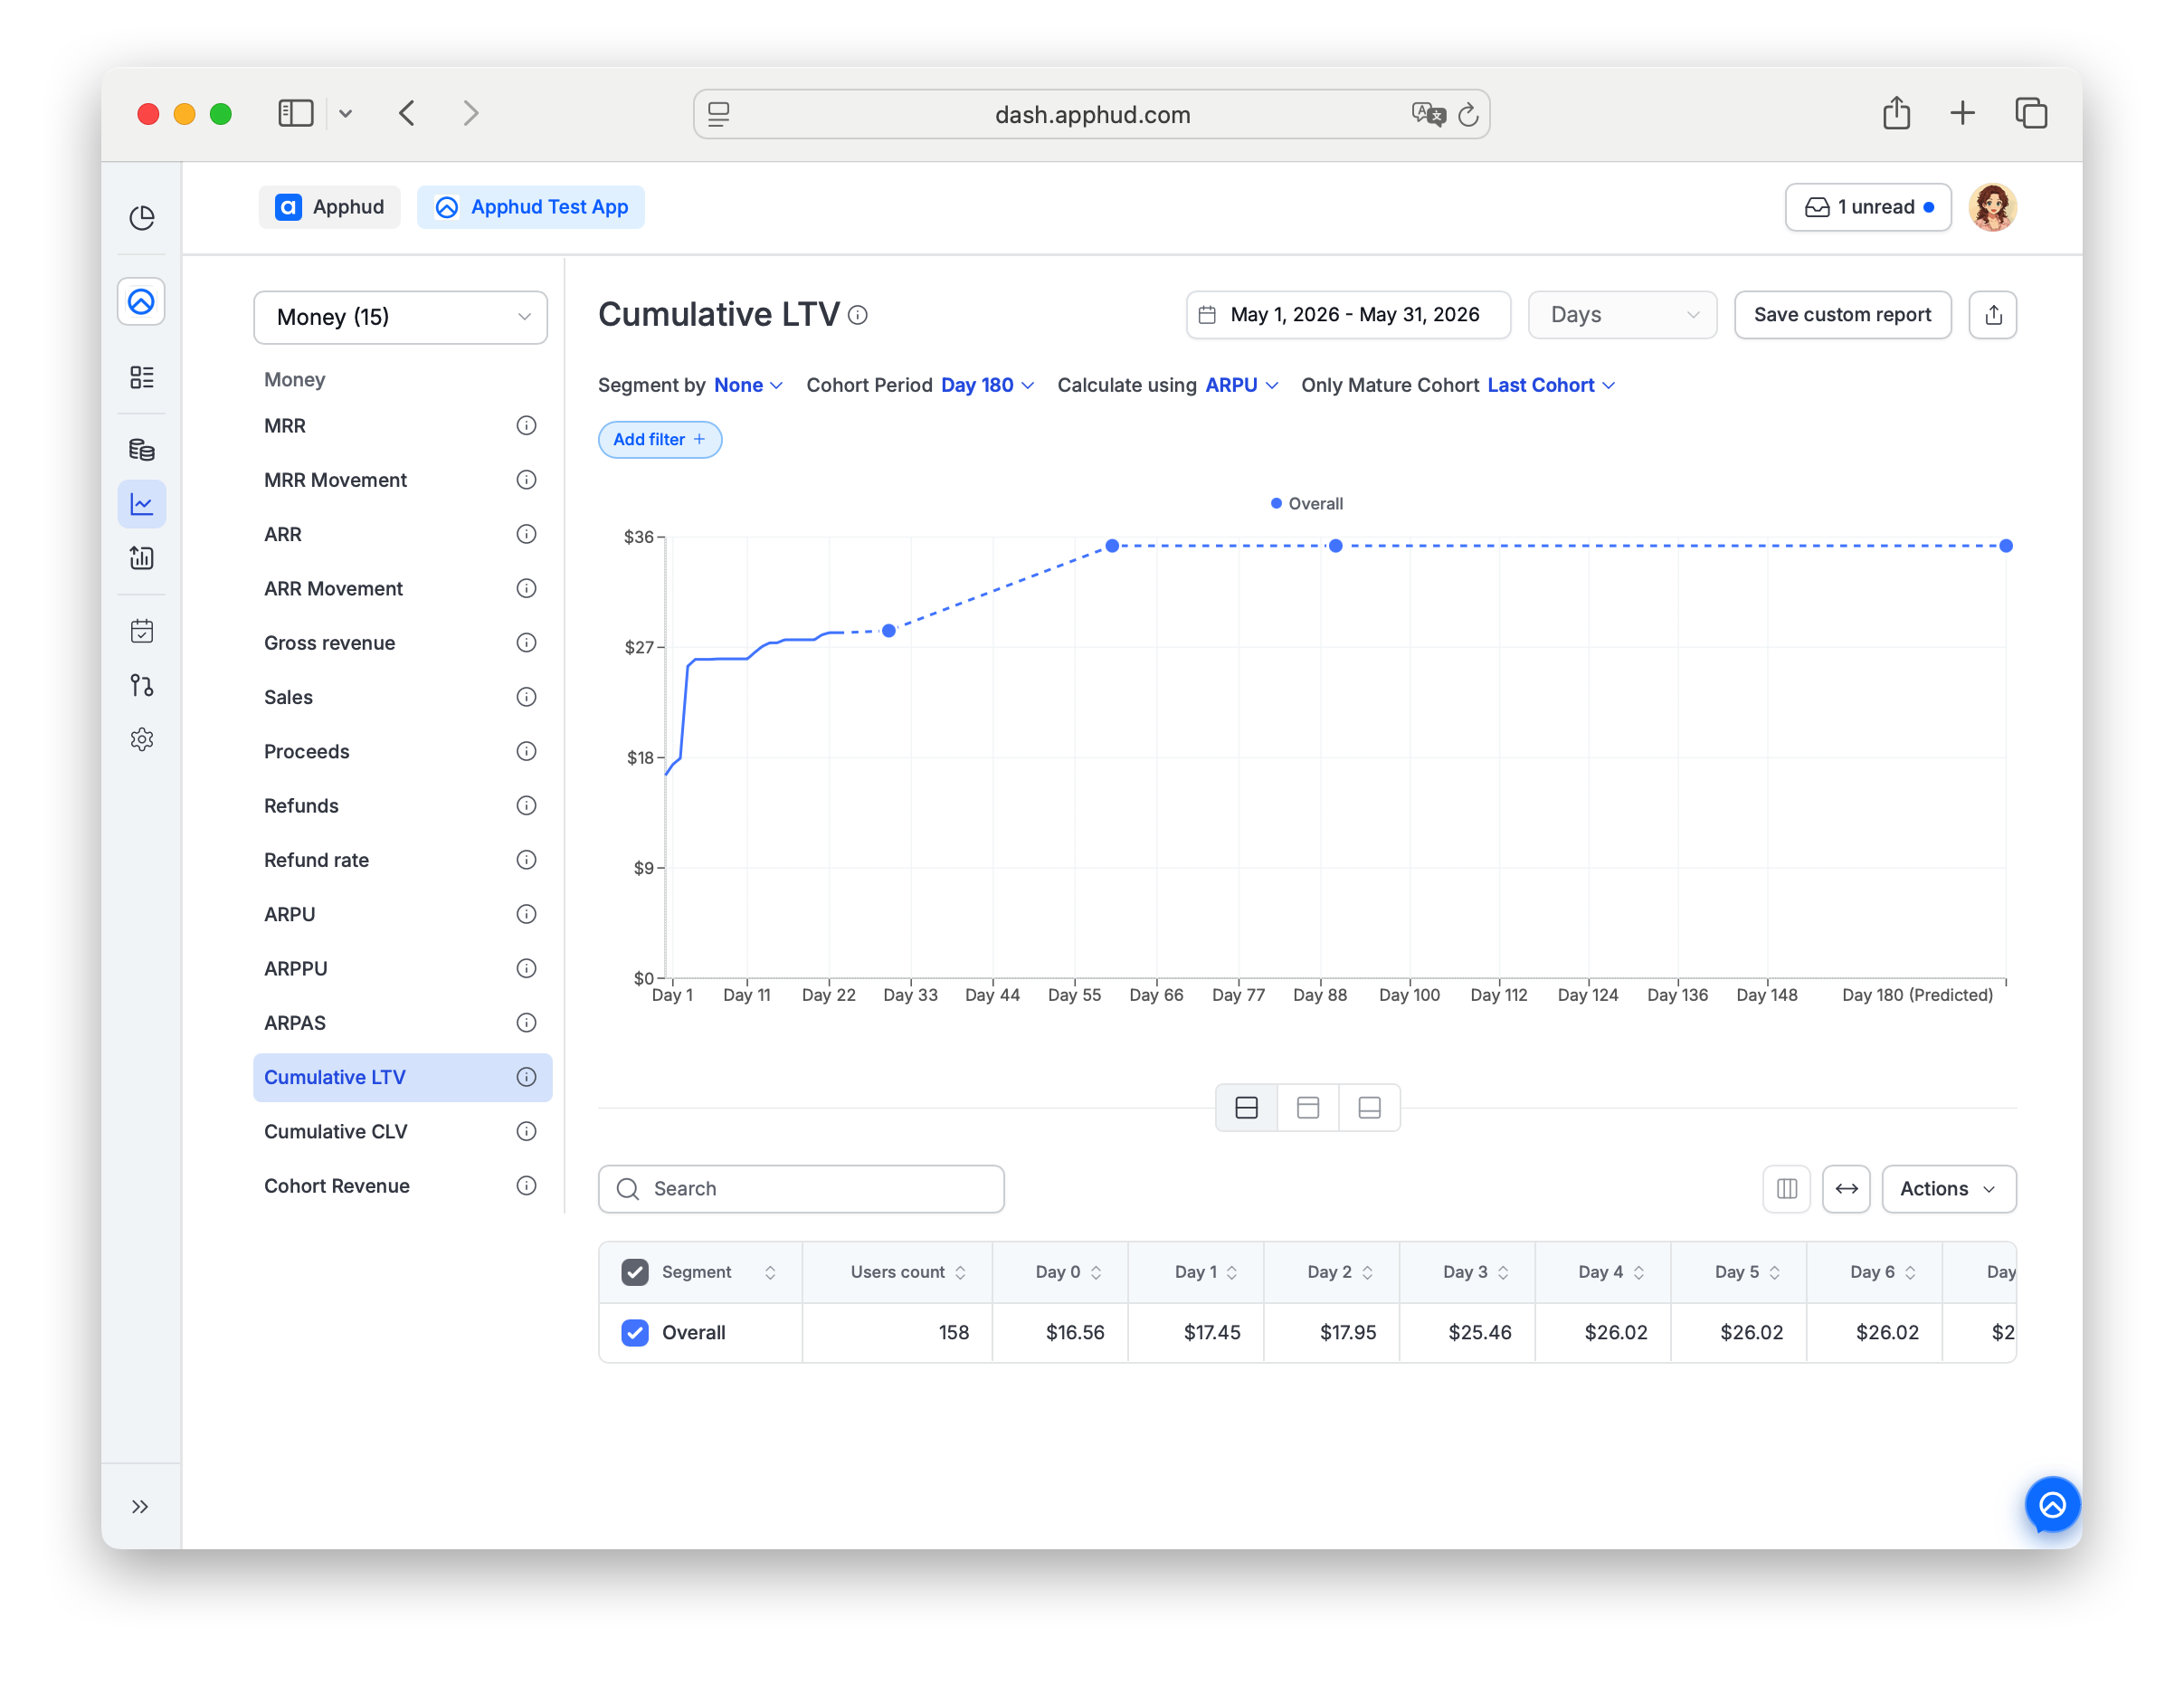
LTV Predictions forecast future revenue per user cohort using a machine-learning model trained on your app's historical data. You can use them to plan acquisition spend, compare A/B test variations on projected long-term revenue, and read the Cumulative LTV chart beyond actual data.
Understanding these forecasts is crucial for businesses to strategically allocate resources toward customer acquisition and retention.
Where predictions are used
| Surface | What predictions add |
|---|---|
| Cumulative LTV chart | Predicted line beyond actual data (30 / 90 / 180 / 365-day horizons). |
| A/B test analytics | Predicted metric columns per variation — pARPU, pARPPU, pARPAS, pProceeds (1M / 3M / 6M / 1Y variants). See Experiment Predictions. |
Data requirement
There's no minimum data threshold. If a subscription duration has fewer than two conversion events in your data (except 1-year subscriptions), Apphud falls back to baseline predicted rebill rates by duration interval — these are derived from aggregated anonymous data, not your app's specific history.
Enable predictions
Predictions activation is self-serve.
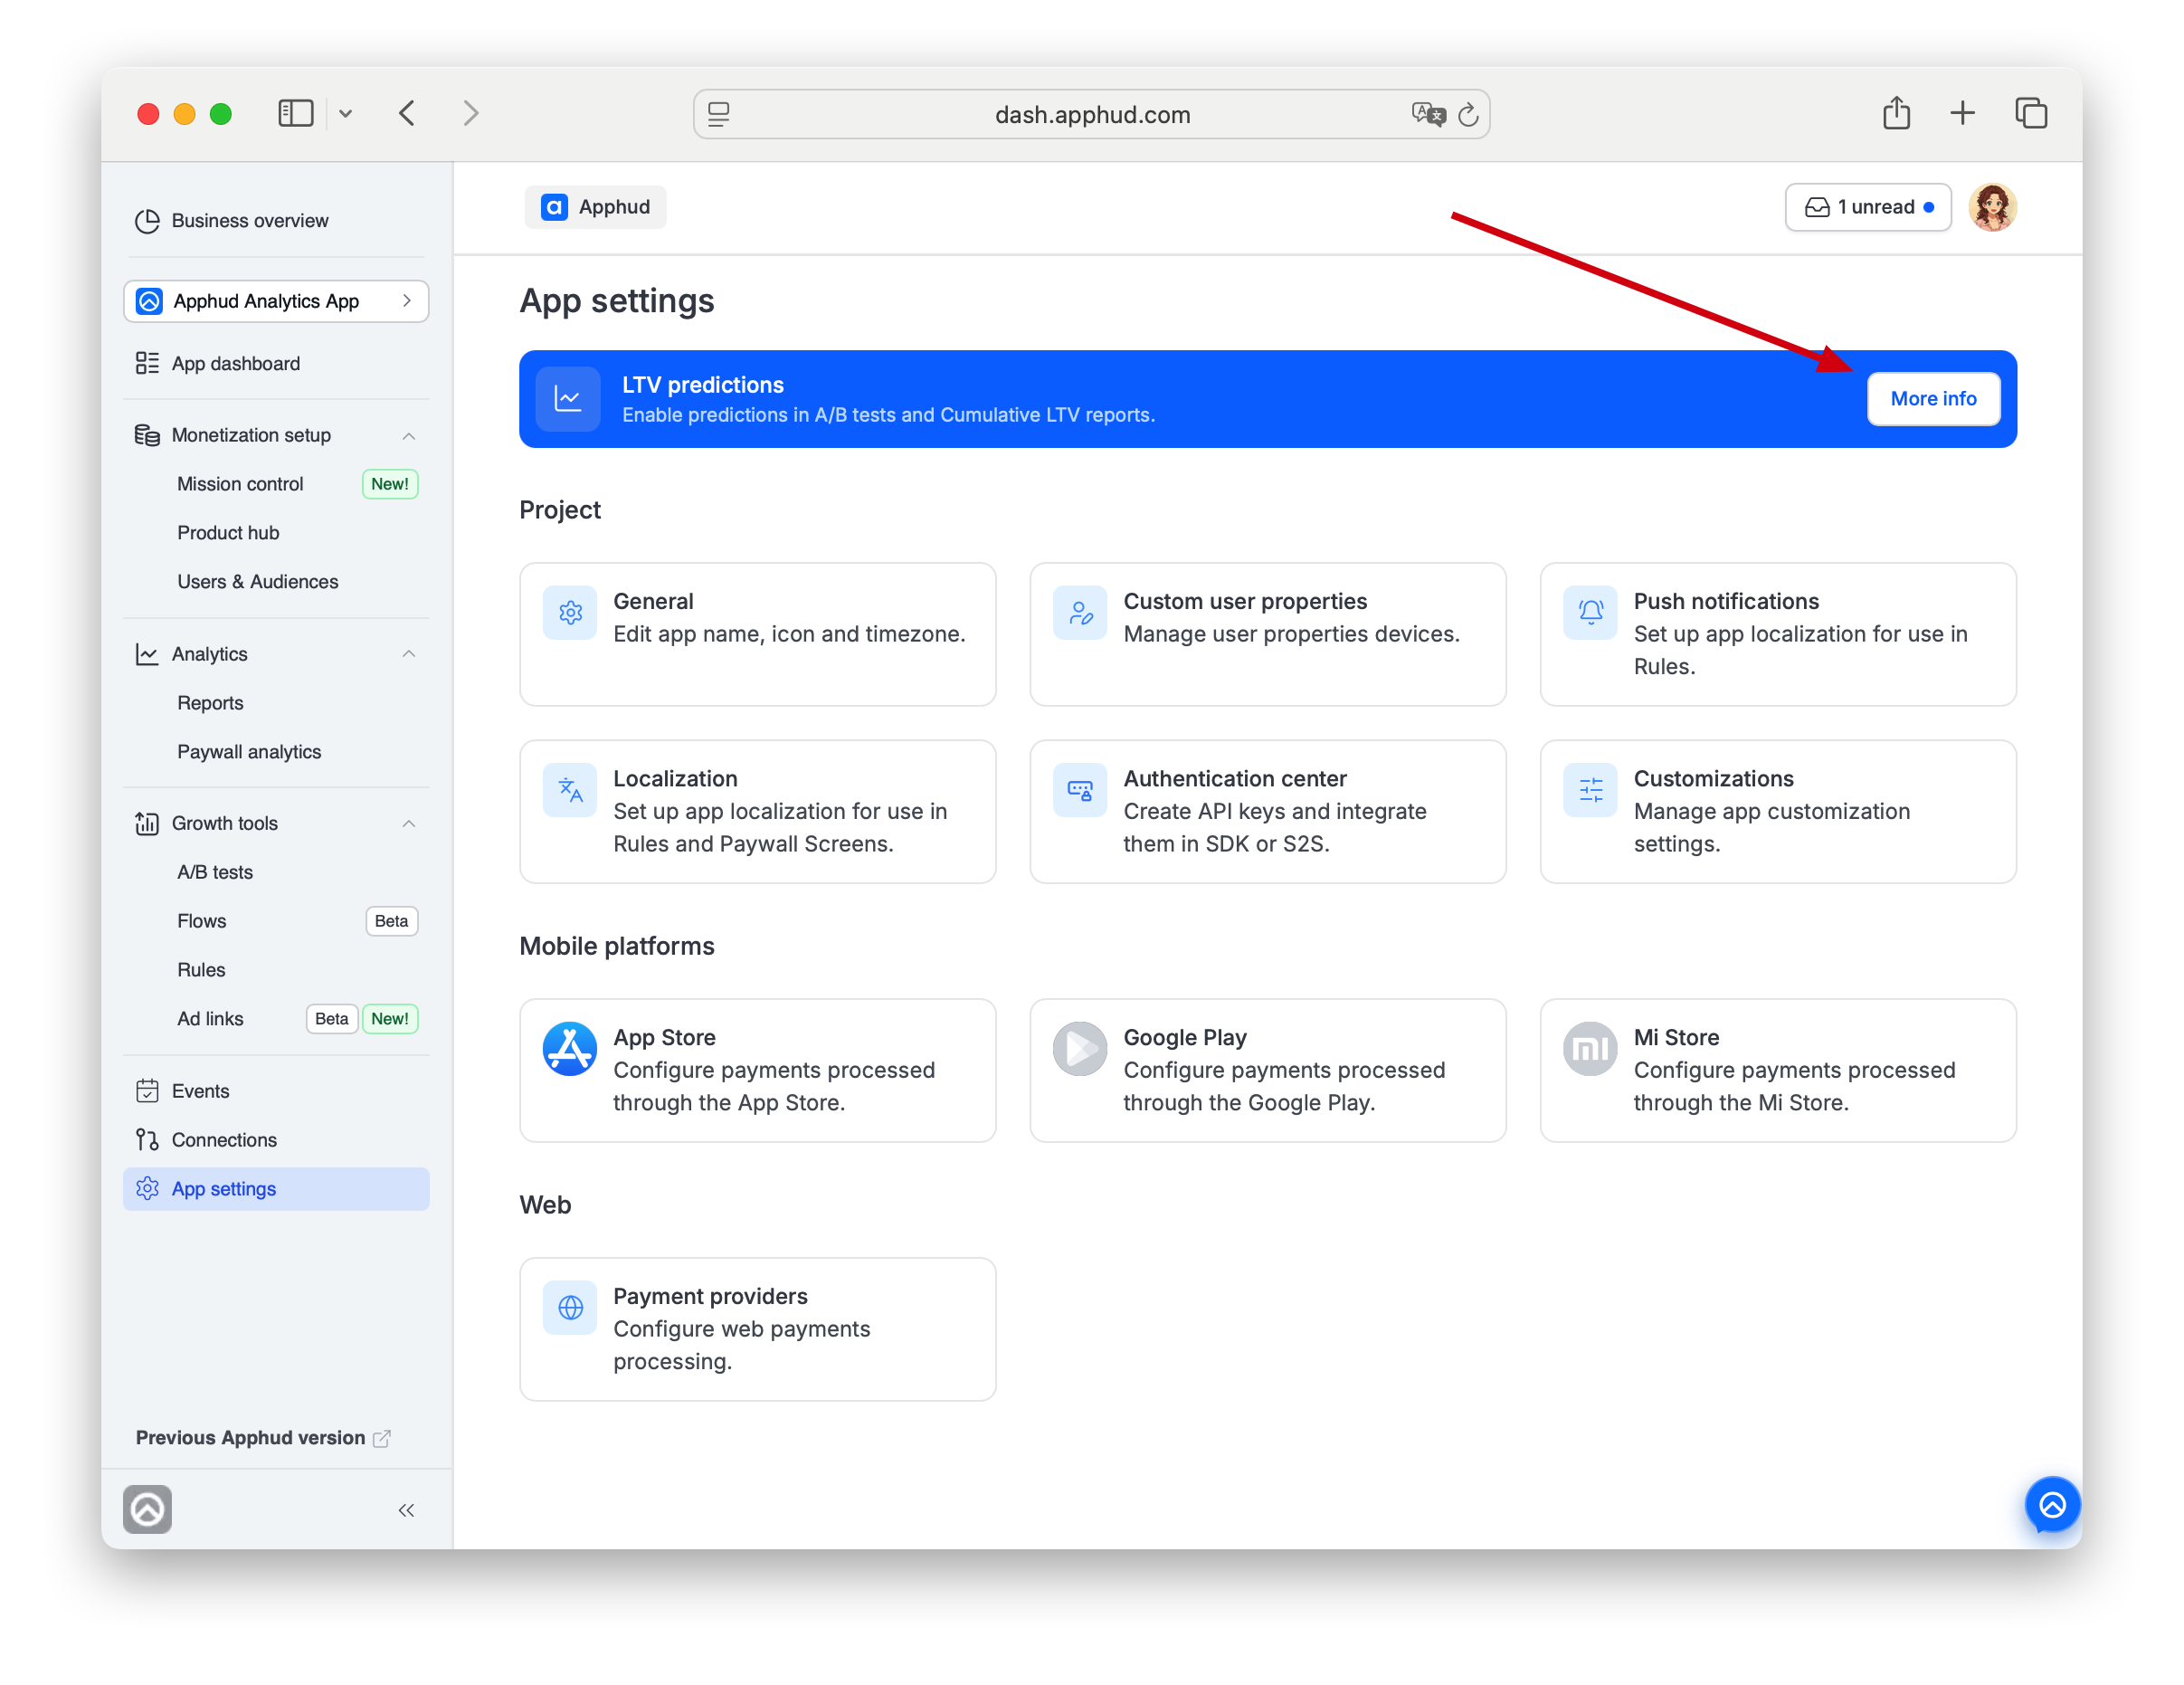
Where: App settings → top of page → LTV predictions banner → More info, then got familiar with the information in the opened pop-up and click Enable now.
Plan requirement: Self-serve activation is available on Expert plan and above. On lower plans the banner explains the plan gate; upgrade your plan in Plan and billing to enable.
What happens after activation:
-
Apphud trains the prediction model on your app's historical data. Allow at least 24 hours before predictions appear.
-
Once trained, the model updates daily at 00:00 UTC and undergoes a full recalibration weekly.
-
Predicted metrics appear automatically in the surfaces above. In A/B test analytics, predicted columns appear in Edit columns → Only admin group — toggle them on.
-
Once activated, the App settings banner switches to "Predictions are enabled at {date-time}" with a × to dismiss.
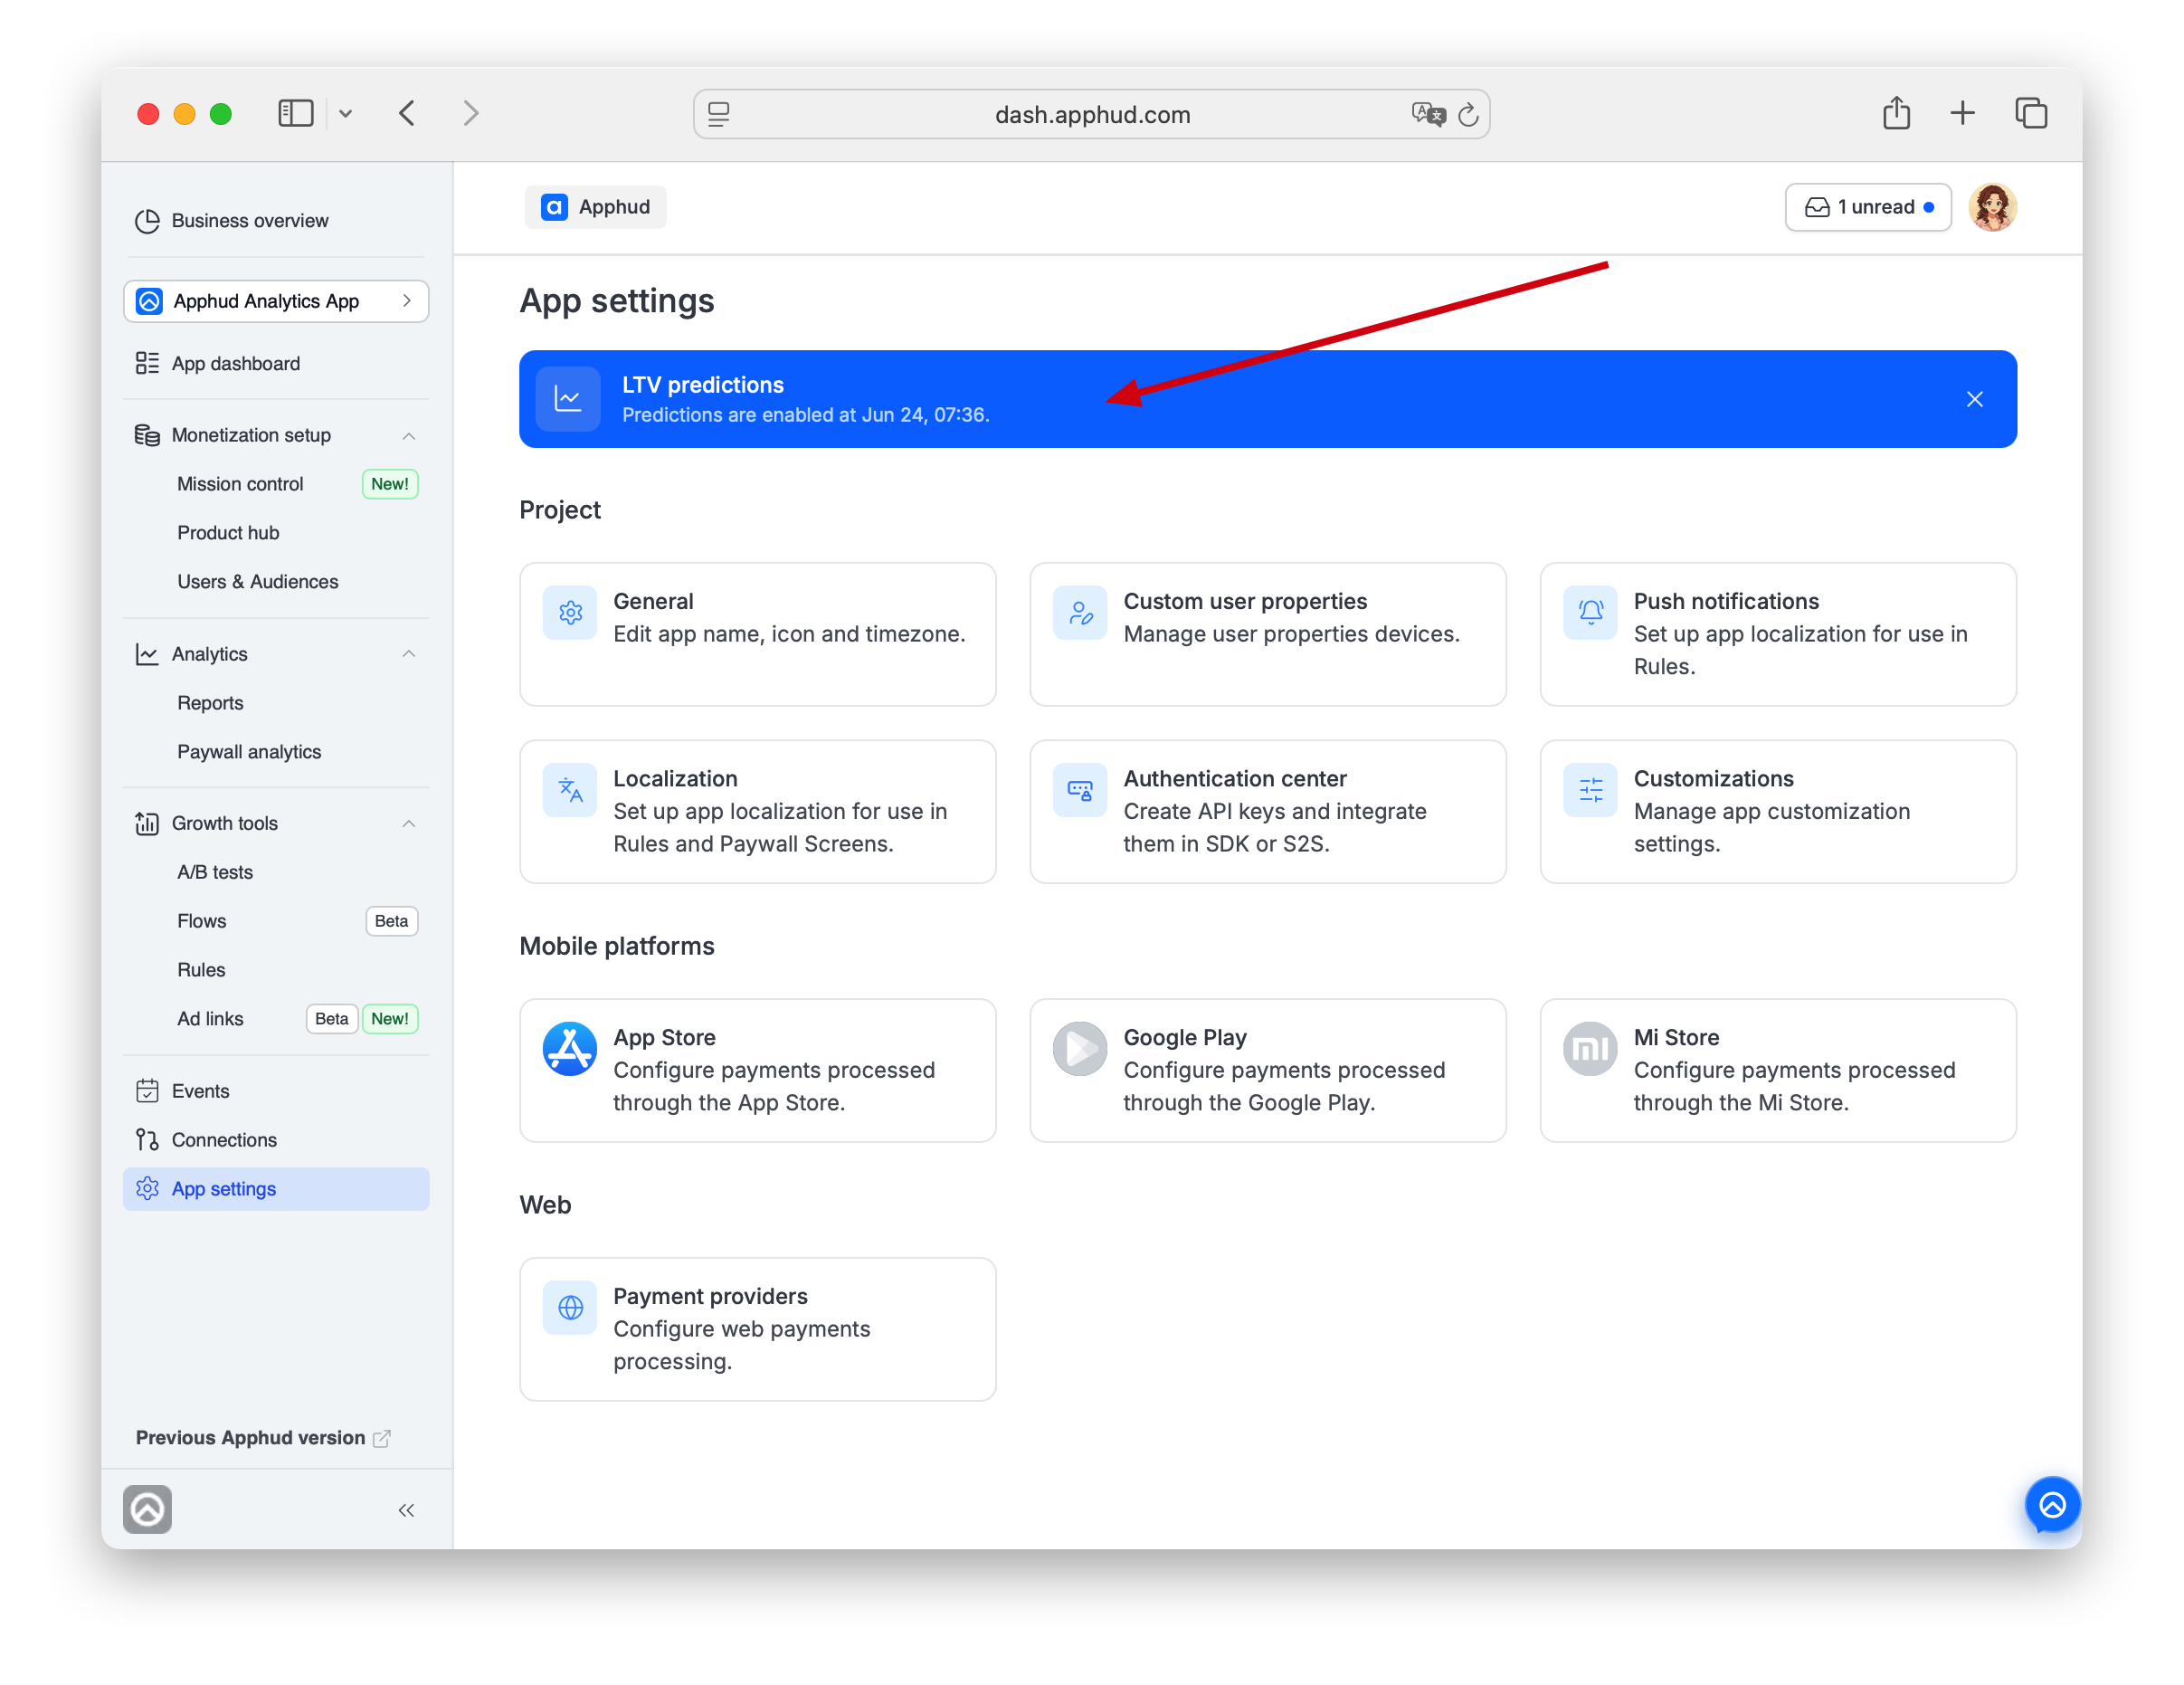
NoteDismissing the activation banner is one-way — there's no way to view the original activation timestamp afterward in the cabinet. Not a problem in practice: predictions are visible on the charts themselves, and the banner is purely informational.
How it works
The model is a probabilistic model based on churn / renewal history. It estimates parameters of a probability distribution that maximize the likelihood of observed retention.
Update cadence
- Daily refresh at 00:00 UTC.
- Full recalibration weekly.
- New-day data appears the following day.
Subscription types
The model works best for weekly and monthly subscriptions. Predictions for less common durations (e.g., quarterly) are still produced, but with wider confidence intervals.
Inputs used
- Purchase history (subscriptions and non-renewing).
- Free trial activity.
- User demographics (where available).
In charts that support predictions, a dashed line marks forecasted data. Adjust the chart's cohort period (30 / 90 / 180 / 365 days) to extend the forecast horizon.
The calculation has two pipelines:
- Model. Calculates predicted rebill rates per segment using transaction history.
- Predictions. Applies those rebill rates to individual subscriptions based on their current renewal iteration.
Model (technical)
The model is a shifted Beta-Geometric (sBG) — the standard approach for discrete-time subscription retention. The math finds parameters p of a probability distribution that maximize the likelihood of observed renewals.
The three metrics the model produces map to functional characteristics of a discrete random variable:
- Retention rate → reverse of the hazard function
h(p, t). - Churn rate → probability mass function
P(p, t). - Rebill rate → cumulative survival function
S(p, i).
Worked example
A 3-month subscription with the following observed funnel:
| Iteration | 0 | 1 | 2 | 3 |
|---|---|---|---|---|
| Renewals | 200 | 80 | 50 | 35 |
Iteration 0 = the subscription started.
Derived metrics:
| Iteration | Retention rate | Churn rate | Rebill rate |
|---|---|---|---|
| 0 | 1 | ||
| 1 | 40% | 60% | 1.4 |
| 2 | 62.5% | 15% | 1.65 |
| 3 | 70% | 7.5% | 1.825 |
Fitting the sBG model gives:
| Iteration (t) | Retention rate (1-h(t)) | Churn rate (P(t)) | Rebill rate (sum(S(i))) |
|---|---|---|---|
| 0 | 1 | ||
| 1 | 40.10% | 59.90% | 1.401 |
| 2 | 61.34% | 15.50% | 1.647 |
| 3 | 71.46% | 7.02% | 1.823 |
| 4 | 77.38% | 3.98% | 1.959 |
| 5 | 81.27% | 2.55% | 2.069 |
| 6 | 84.02% | 1.77% | 2.162 |
| 7 | 86.06% | 1.29% | 2.242 |
| 8 | 87.64% | 0.99% | 2.312 |
From iteration 4 onward, rebill rates are predicted.
For the math, see Fader & Hardie — How to Project Customer Retention.
Segmentation
The model can't reliably fit on a single global segment, so Apphud uses a cascade of segments at different specificity levels and falls back hierarchically.
The cascade for predicted rebill rates:
duration_interval
duration_interval, app_id
duration_interval, app_id, is_trial
duration_interval, app_id, is_trial, country_tier
A subscription's prediction is taken from the most specific matching segment. If no model exists at the deepest level, fall back to the next-broader segment, and so on up to duration_interval alone.
| duration_interval | app_id | is_trial | country_tier | predicted_rebill_rate (1Y) | p |
|---|---|---|---|---|---|
| ... | ... | ... | ... | ... | ... |
| 1 month | overall | overall | overall | 4.5 | (3.5, 5.6) |
| 1 week | id1234567890 | overall | overall | 7.9 | (4.3, 1.6) |
| 1 year | id1111111111 | true | overall | 1.3 | (2.5, 3.0) |
| 3 month | id6666666666 | false | US | 2.3 | (0.5, 1.7) |
p contains the probability-distribution parameters of the fitted model.
Per-subscription predictions
For each subscription, Apphud:
- Checks if the subscription is active — if not, predictions aren't applied.
- Finds the closest matching model in the cascade.
- Looks at the subscription's last completed iteration.
- Applies the model from that iteration onward, including fee, VAT, and price.
This is a dynamic prediction — predictions update each time the subscription renews.
What counts as activeA subscription with an expiration date later than today is active — even if it was canceled but hasn't expired yet. Predicting only "renewing" subscriptions would underestimate revenue.
Trial subscriptionsIf a subscription is in its trial period, predictions apply the historical trial conversion rate for the matching segment, then proceed as for an active paid subscription.
Best practices
- Pick broader date ranges for more accurate predictions. Very short windows have too little data to fit a stable model.
- Use filters sparingly. Each filter shrinks the cohort. Predictions degrade as the cohort gets smaller.
- Scale your window to your volume. Apps with high daily transaction volumes can use single-day windows. Lower-volume apps should pick windows covering at least 200 subscribers for reliable predictions.
Privacy and data use
- Data used for predictions is anonymous and per-app. Predictions for your app are calculated only from your app's data — except for fallbacks below.
- When your app has insufficient history at the deepest cascade level, Apphud falls back to aggregated anonymous data at broader levels (duration interval) to keep predictions working. No identifiable data is shared across apps.
Activate predictions for an app
To activate predictions for a specific app, open the app's App settings page. The top of the page shows an LTV predictions banner with an Enable action. Once enabled, the banner switches to a confirmed state showing the activation timestamp; you can dismiss it.
FAQ
Are non-renewing purchases included in predictions?
Yes, but only as realized revenue. Non-renewing (consumable / one-time) purchases are counted in ARPPU, ARPU, and the actual portion of the Cumulative LTV chart, exactly like subscription payments.
The forecast part — the dashed line and the predicted metric columns (pARPU, pARPPU, pARPAS, pProceeds) — only extends auto-renewable subscription renewals. The sBG model predicts future renewals, and a non-renewing purchase has nothing to renew, so no future revenue is projected for it.
In short:
Predicted LTV = all revenue already earned (including non-renewing) + predicted future subscription renewals.
If non-renewing purchases are a large, recurring share of your revenue, predicted LTV will be conservative — it does not anticipate future repeat one-time purchases. Model that portion of revenue separately.
How long after I enable predictions do they appear?
At least 24 hours for initial training. After that, predictions refresh daily at 00:00 UTC. If your app already has historical data when you enable, the first usable predictions appear the next day.
My plan is below Expert. Can I still see predictions somewhere?
Self-serve activation is gated to Expert and above. If your plan doesn't include predictions, the App settings banner shows the plan gate. Predictions can't be enabled on Free / lower-tier plans. Upgrade in Plan and billing.
Why don't I see predictions for a specific subscription duration?
The model needs at least two conversion events at that duration to fit a per-app prediction. For durations below that threshold, Apphud falls back to baseline rates by duration — these still produce a prediction, but with less app-specific accuracy.
The exception is 1-year subscriptions — the threshold is relaxed there because per-app data for long durations is naturally sparse.
My Cumulative LTV chart shows a dashed line that ends earlier than I'd expect. Why?
The chart's forecast horizon is set by its cohort period control (30 / 90 / 180 / 365 days). The dashed segment ends at that horizon. Extend the period to see further out.
Why don't predictions account for my recent marketing changes?
The model is trained on historical data and updates daily. Significant behavior shifts (e.g., a new pricing model, a major paywall change) take time to propagate into predictions — typically several days of new data before predicted rebill rates adjust.
Updated about 1 month ago