
ARPU
Average Revenue Per User — total revenue divided by total users in the cohort.
ARPU (Average Revenue Per User) measures the average revenue generated from all users in a cohort, including total revenue from subscriptions and non-renewing purchases.
ARPU = Total revenue / Total users in cohort
ARPU is a core ROI input — comparing it to CPI (cost per install) tells you whether a paid acquisition channel is profitable. Segmenting ARPU by ad network or campaign surfaces which sources bring the highest-paying users.
Find ARPU under Analytics → Reports → Money in the sidebar.
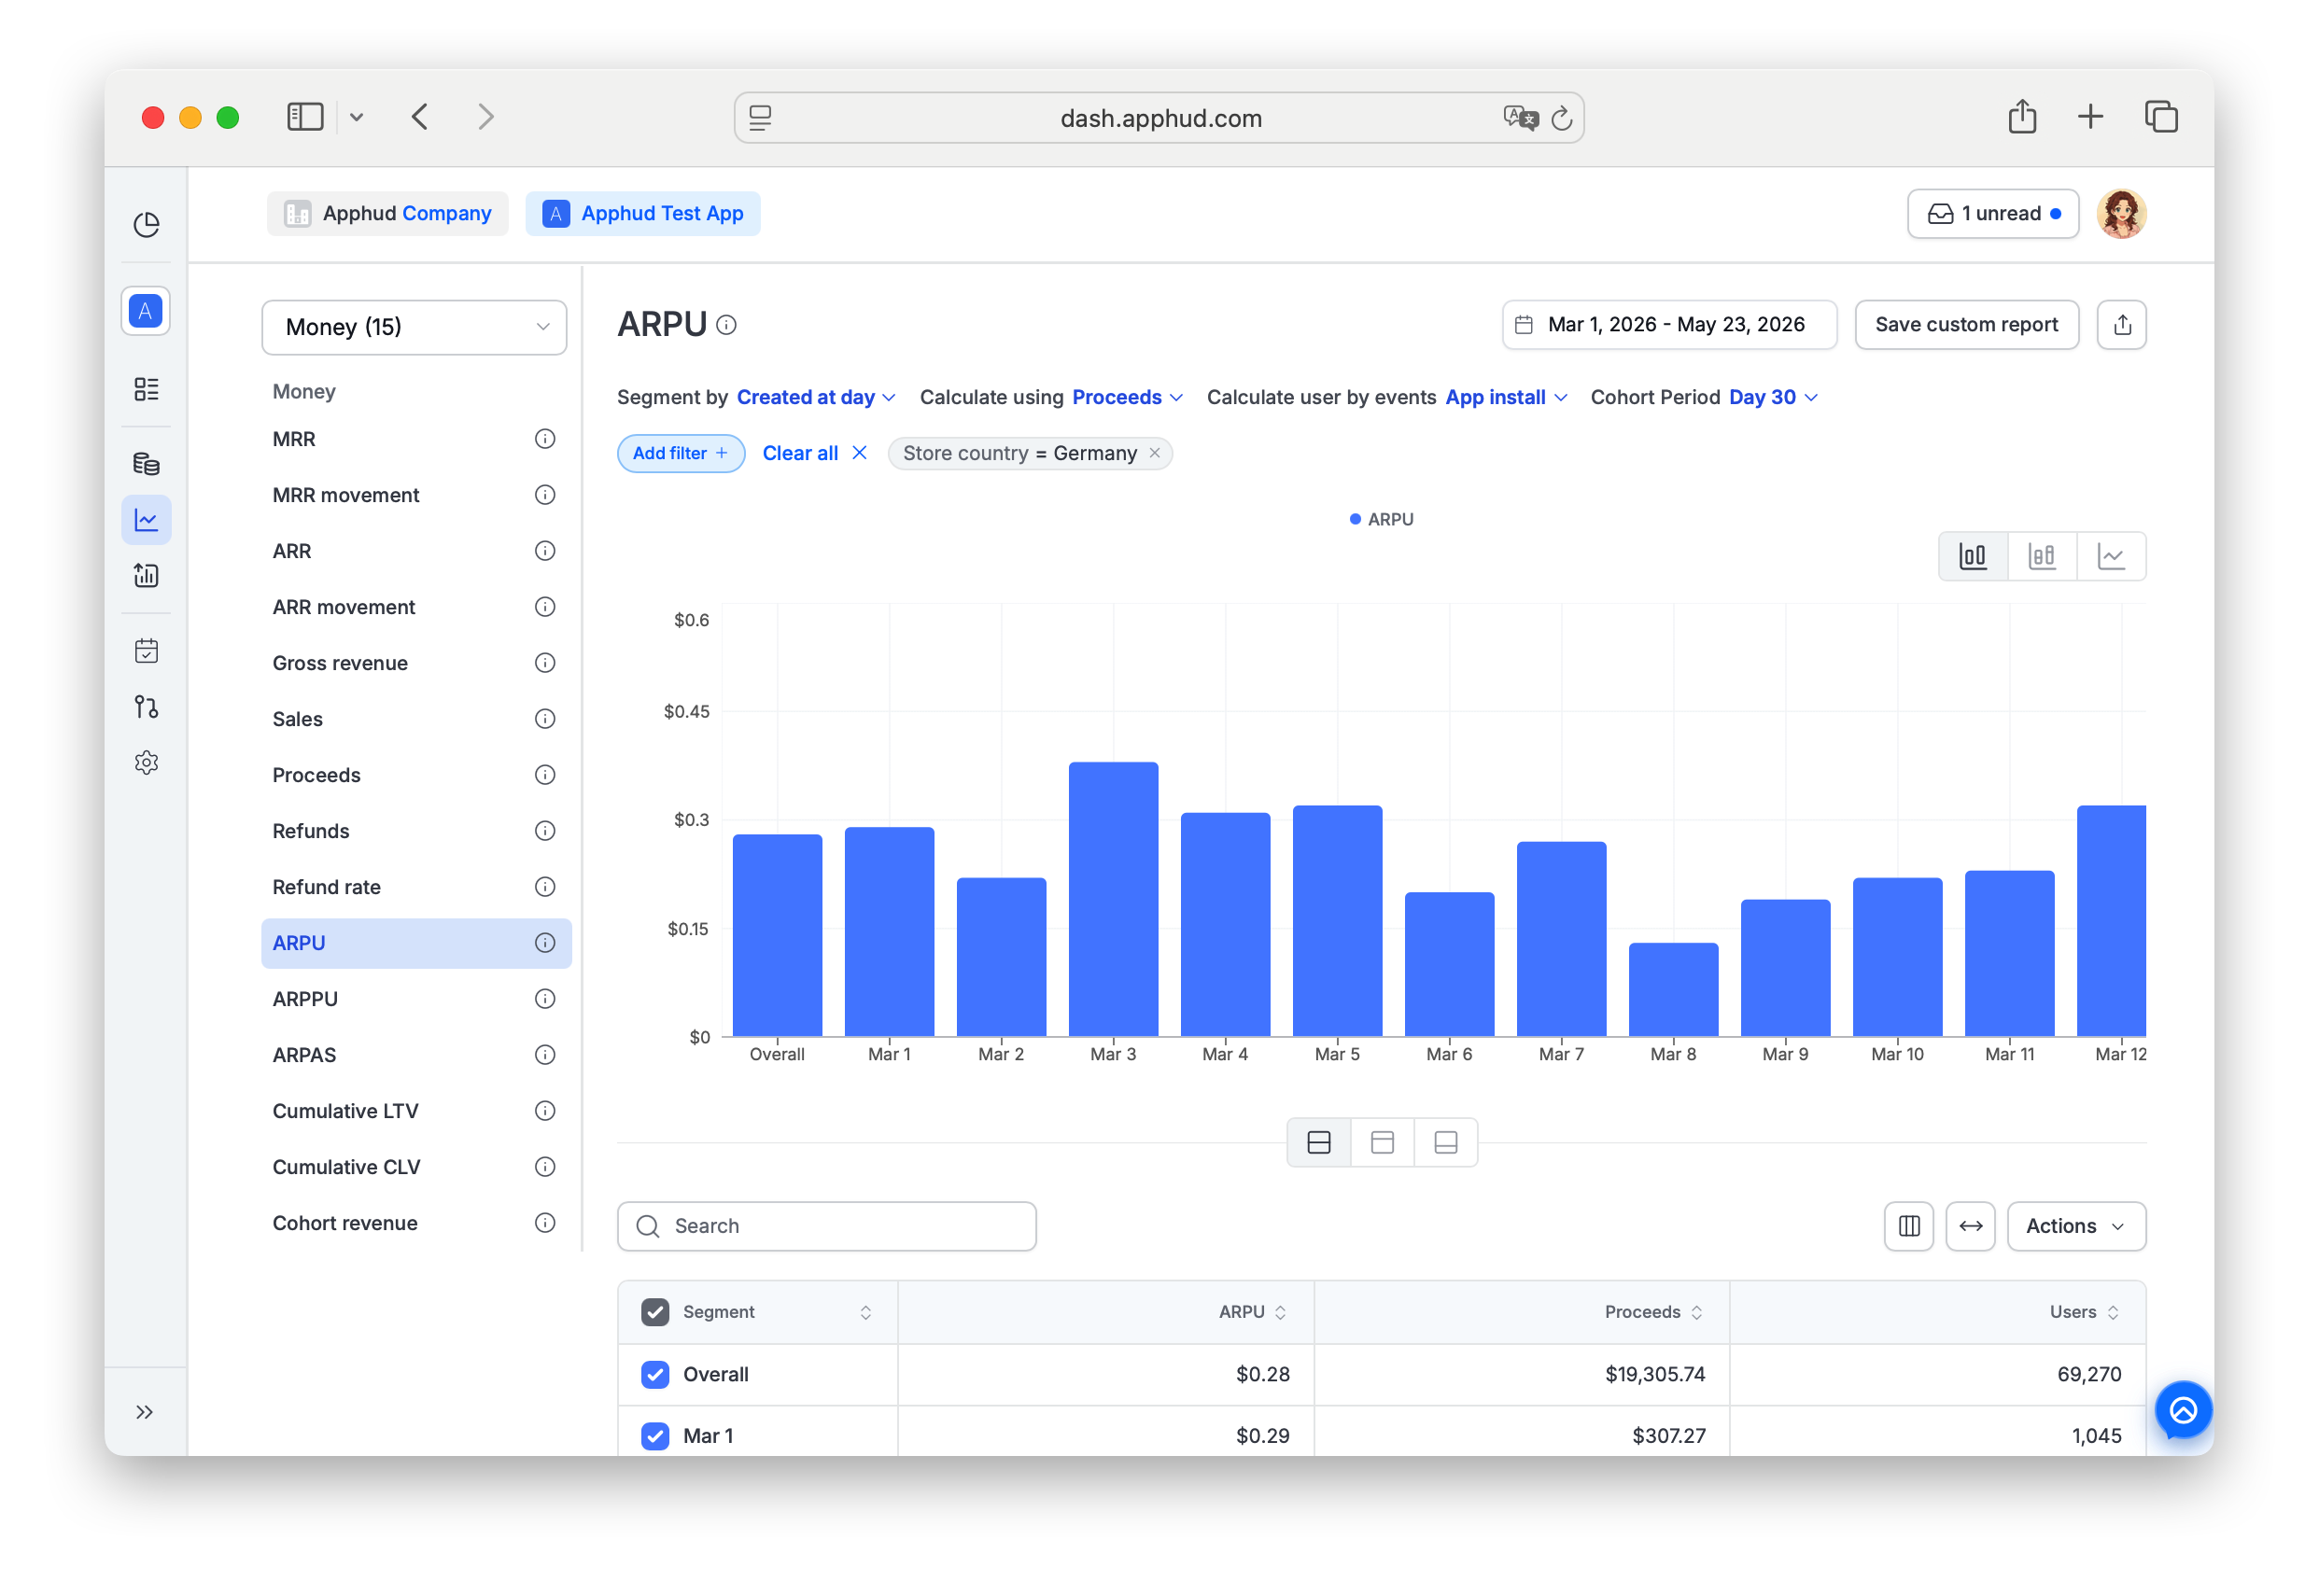
Chart-specific parameters
Calculate using
- Proceeds (default) — average revenue after refunds, store commissions, and VAT.
- Sales — average revenue after refunds, but before commissions and VAT.
Switches the numerator. See Proceeds and Sales for the metric definitions.
Cohort Period
Default: Max (no limit). Available options:
| Option | What it counts |
|---|---|
| Day 3 | Revenue through day 3 of each user's life. |
| Day 7 | Revenue through day 7. |
| Day 30 | Revenue through day 30. |
| Day 180 | Revenue through day 180. |
| Day 365 | Revenue through day 365. |
| Enter a value | Opens a popup where you type a custom number of days. |
- Day 0 = the first 24 hours after install.
- Day 1 = the next 24 hours, and so on.
Limits how far into a user's lifetime is counted. Useful for "ARPU by Day N" style payback analysis — for instance, if ARPU by Day 3 is $0.10, the average user brought $0.10 by their 4th day.
Calculate users by events
Defines who counts in the denominator (the user pool):
- App Installs (default) — every user who installed in the cohort period. ARPU = Total revenue / Installs.
- Trial started — only users who started a trial. ARPU = Total revenue / Trial starters.
Example with App Installs: 100 new users in the period generated $10 → ARPU = $0.10.
Example with Trial started: 100 installs of which 50 started trial generated $10 → ARPU = $0.20.
Reading the table
Below the chart, the results table shows the calculated ARPU and the underlying components for each row:
- ARPU — average revenue per user for the selected cohort period.
- Proceeds or Sales — the cohort's total revenue within the selected Cohort Period, matching your Calculate using setting.
- Users — the number of users in the cohort (the denominator), per Calculate users by events.
For example, with Cohort Period = Day 30 and Calculate using = Proceeds, the Proceeds column shows the total Day 30 proceeds for the cohort, and Users shows the cohort size.
Supported filters and segments
ARPU supports most standard segments and filters documented in Reports → Filters and segments.
Not supported as Segment by (subscription-product-level dimensions don't apply to ARPU's all-users denominator):
- Product
- Paywall
- Base plan
If you need to break out revenue by these dimensions, use ARPPU (per paying user) or ARPAS (per any subscriber).
Filter-only (not available as Segment by):
- Permission group — segment support is planned, currently filter only.
- Screen
- Experiment variations
FAQ
What's the difference between ARPU, ARPPU, and ARPAS?
The denominator changes:
- ARPU — divides by all users (installs).
- ARPPU — divides by paying users only.
- ARPAS — divides by any subscribers, including users on free trials.
ARPU ≤ ARPAS ≤ ARPPU (usually). Use ARPU for marketing ROI; ARPPU/ARPAS for unit-economics among subscribers.
Can I see a cohort's total revenue and user count (e.g. D30)?
Yes — it's already in the results table. Set Cohort Period to Day 30, then read the row you need:
- Proceeds / Sales — total cohort revenue through Day 30 (matching Calculate using).
- Users — cohort size.
- ARPU — revenue ÷ users.
Why does my ARPU value drop when I switch Calculate users by events from "App Installs" to "Trial started"?
It can go either way — the numerator stays the same but the denominator shrinks (only trial starters). If revenue per trial starter is high relative to the overall install pool, ARPU rises; if revenue is concentrated outside trial starters, it falls.
How is ARPU different from a marketing ARPU number I see elsewhere?
Apphud's ARPU is cohort-based — total revenue from a cohort divided by that cohort's user count, up to the selected Cohort Period. Many ad platforms report a period-based ARPU — revenue in a calendar period divided by active users in that period — which is structurally different. Compare with care.
Which metric should I compare to CAC / CPI / CPA?
Match the denominator to your acquisition metric:
- CAC / CPI (cost per install / all acquired users) → compare against ARPU or Cumulative LTV (Calculate using = ARPU). Both divide by the same pool you paid to acquire.
- CPA (cost per paying user or trial converter) → compare against ARPPU or ARPAS.
- For ROI on a specific campaign / period / geo — compare against the same cohort's value, not the all-time app average. See Cumulative LTV → Should I look at all-time or my cohort?.
Can I compute ARPU only for users who started a trial or made a purchase?
Yes — use Calculate users by events:
- App Installs → average across every install (true ARPU).
- Trial started → average across users who started a trial (revenue from those users ÷ trial starters).
For paying-user-only or trial-converter-only views, switch to ARPPU instead (Calculate users by events → Purchase or Trial Converted).
Can I segment ARPU by Country, custom user properties, or A/B test variations?
Yes for Country and custom user properties — they're available as both Filters and Segment by dimensions. See Reports → Filters and segments for the full list.
Experiment Variations is currently filter-only on ARPU (not Segment by). To compare variations side-by-side, use A/B test analytics.
Updated 12 days ago