
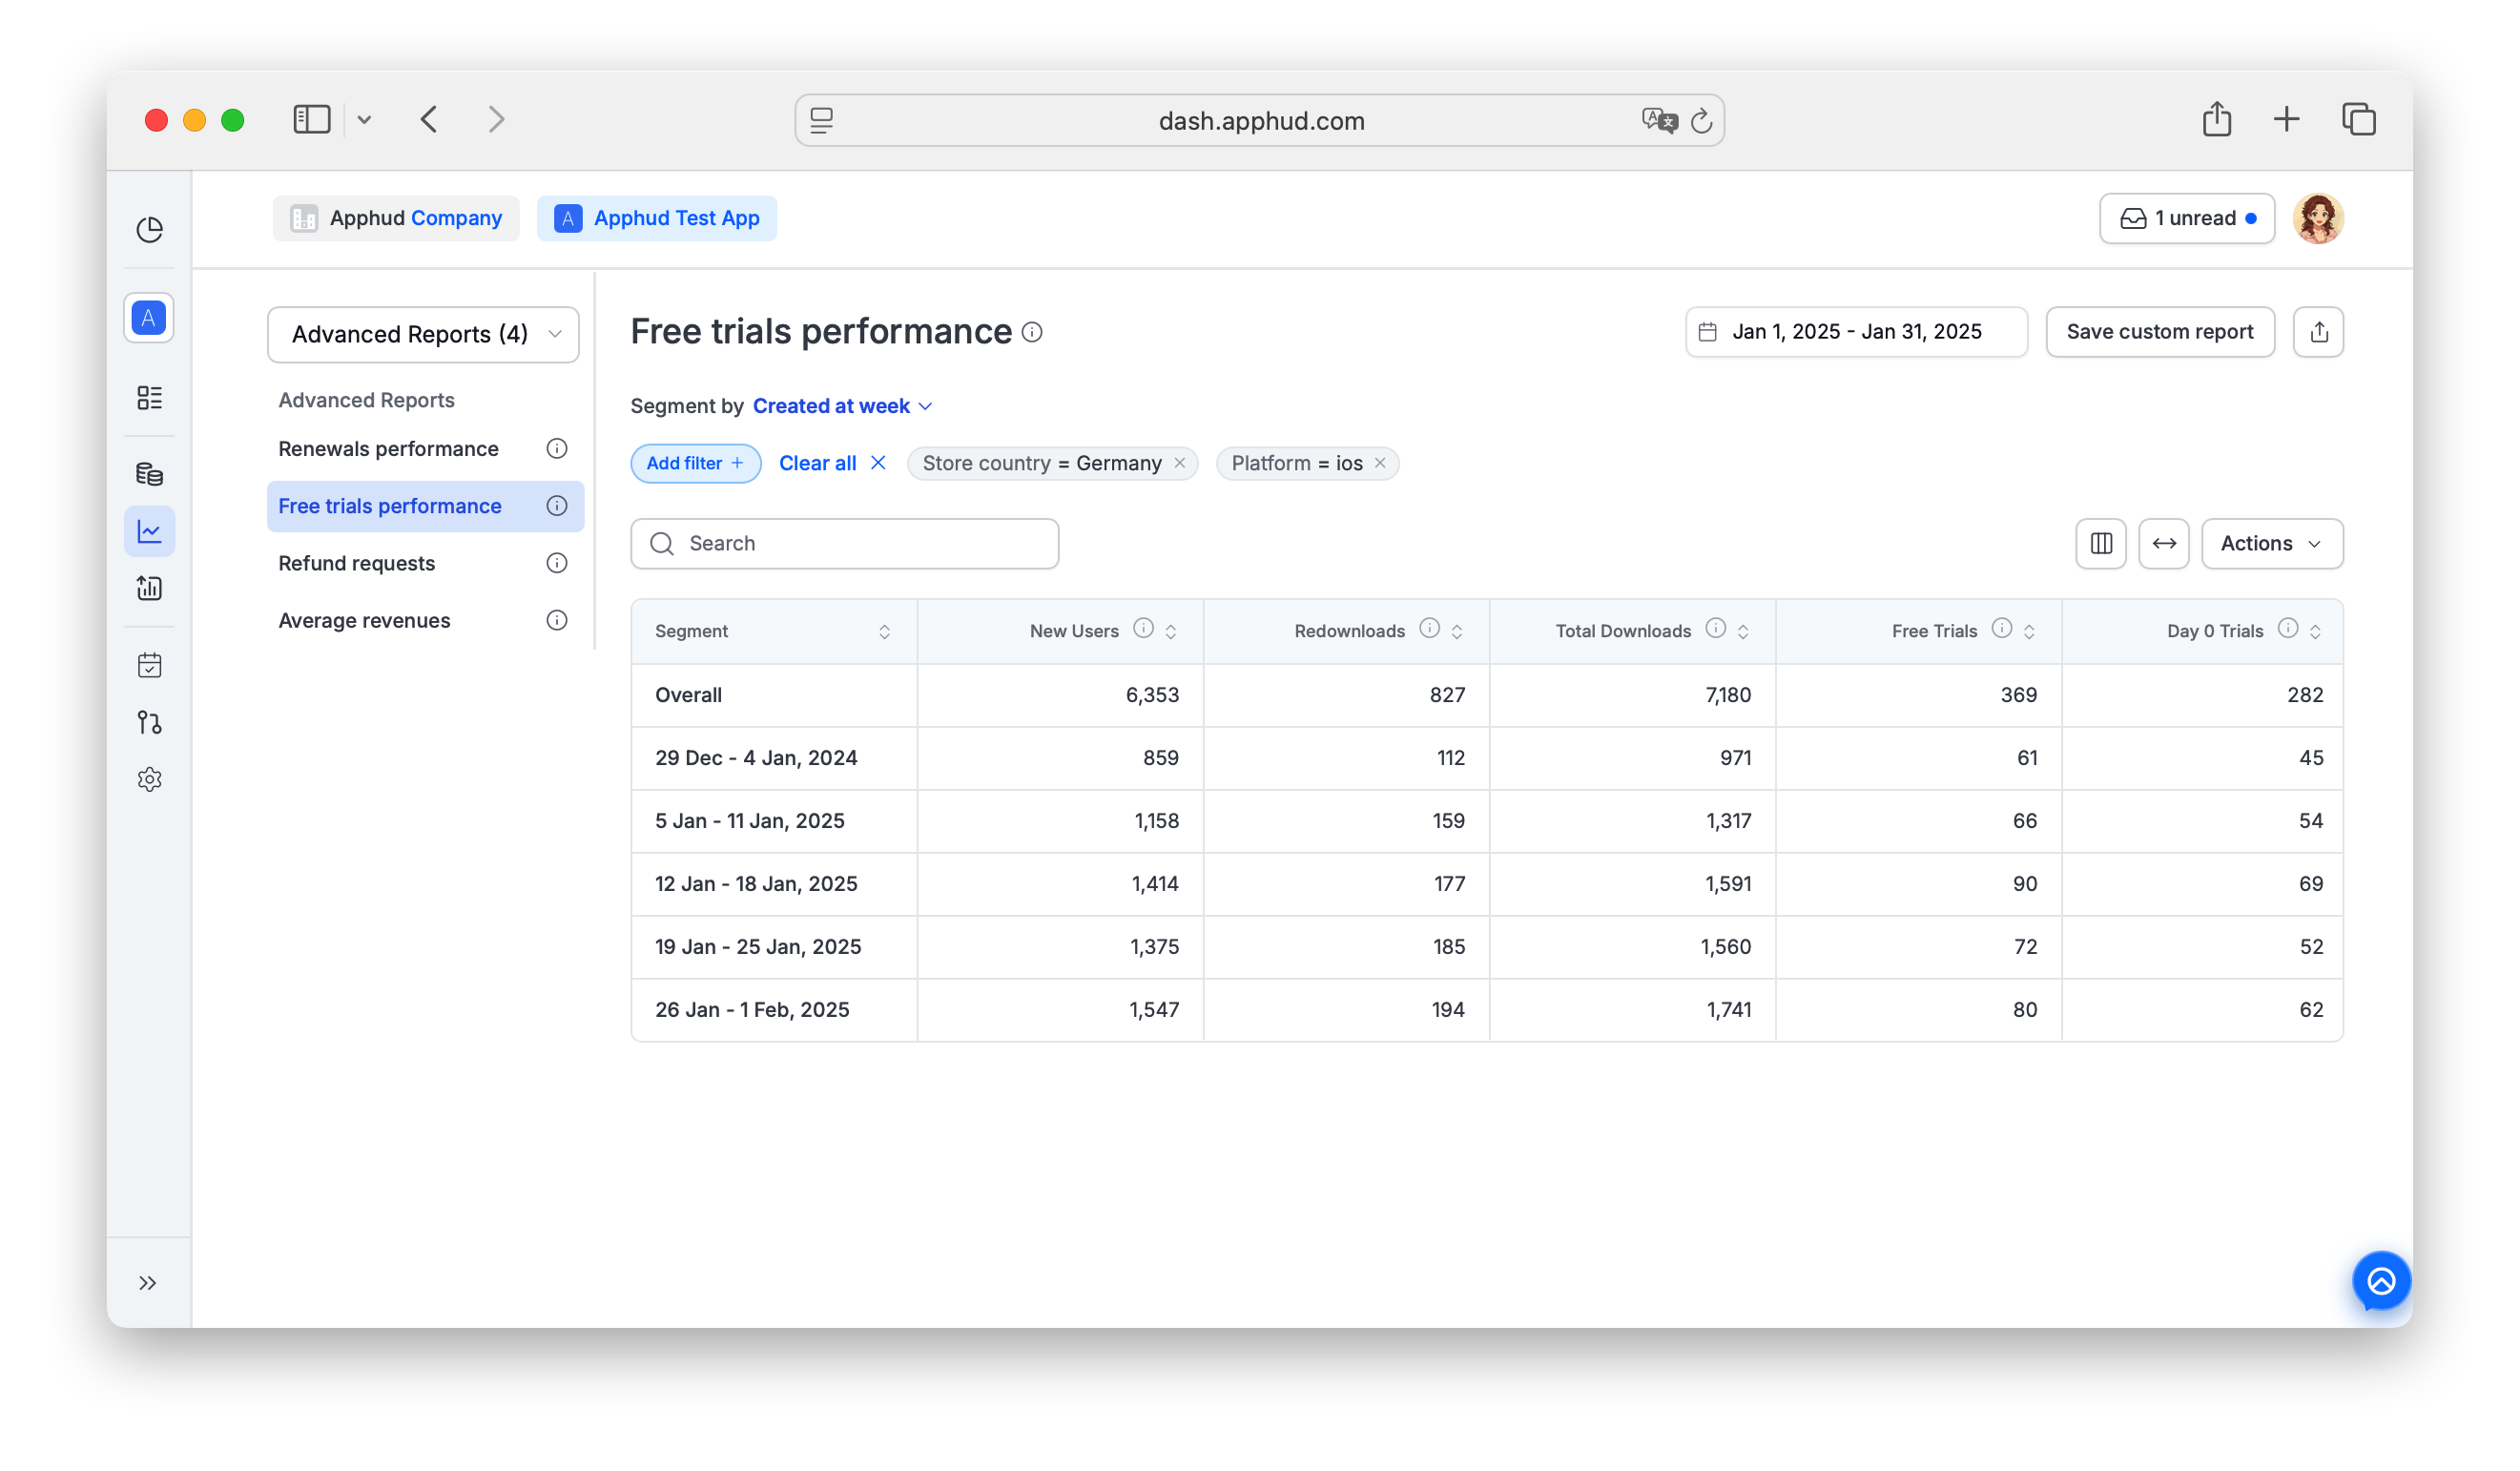
Free Trials Performance
Comprehensive overview of trial engagement, conversion, billing recovery, and cancellation behavior.
Free Trials Performance provides a comprehensive overview of user engagement and conversion performance metrics across downloads, free trials, and billing recovery.
Use it to evaluate how effectively free trials convert into paid subscriptions across products and countries — including trial-to-paid funnels, cancellation timing, and billing-issue recovery during trial conversion.
Find Free Trials Performance under Analytics → Reports → Advanced Reports in the sidebar.
Data availability
Data for this report is available starting from August 10, 2024.
The selected date range applies to New Users, Redownloads, and Total Downloads. Other cohort metrics depend on users who installed or reinstalled within the selected dates and aren't bounded by date.
Platform support
Both iOS and Android are supported. Two metrics are iOS-only due to platform limitations:
- Converted with Promo Offer
- Converted with Different Product
Metrics
33 metrics in total. Toggle visibility via the columns menu. The groups below follow the same order as the report columns — the section headers (Acquisition, Trial engagement, …) just mark the funnel stages.
Acquisition
- New Users — first-time installs in the period.
- Redownloads — reinstalls in the period. Requires iOS SDK 3.0.1+, Android SDK 2.5.0+.
- Total Downloads — New Users + Redownloads.
Trial engagement
- Free Trials — total intro free trials purchased by new users or redownloaders. Cohort metric — trial start time is not date-bounded.
- Day 0 Trials — intro trials purchased within 24 hours of initial install (based on install date, not first launch).
- Session 0 Trials — intro trials purchased within 30 minutes of first launch. Estimated (sessions aren't tracked directly — calculated from trial timing).
- Re-engagement Trials — intro trials purchased after a redownload.
- Active Trials — trials currently active with auto-renew on. Excludes successful charges before period end (those become paid) and trials with auto-renew off.
Use CasesHow quickly users start a trial after downloading the app?
Day 0 Trials and Session 0 Trials show how fast users subscribe after install / first launch — useful for onboarding and marketing optimization. First impressions are crucial for user acquisition.How re-engagement campaigns drive reinstall users to a trial?
Re-engagement Trials reflect how reinstalled users convert into a trial. Use them to optimize your re-engagement flow.
Conversion
- Total Trial Conversions — total trial-to-paid conversions (on-time + billing-issue recovered).
- Total Trial-to-Conversion Rate (%) — Total Trial Conversions / Free Trials.
- Install-to-Conversion Rate (%) — Total Trial Conversions / New Users.
- Download-to-Conversion Rate (%) — Total Trial Conversions / Total Downloads.
- On-Time Conversions — trials converted on time (before or at period end). Includes Google Play resume-from-pause conversions.
- On-Time Conversion Rate (%) — On-Time Conversions / (On-Time Conversions + Billing Issues).
Use CaseHow well the subscription price fits a specific user audience?
On-Time Conversion Rate may vary by product price and country. A higher rate corresponds to a lower Billing Issue Rate, reflecting better alignment between pricing and user affordability.
Billing
- Billing Issues — failed trial conversions due to billing. Unique per subscription period, not per bank-charge attempt.
- Billing Issue Rate (%) — Billing Issues / Free Trials.
- Recovered Conversions — trials converted from Grace Period or Billing Retry. The value may change while Pending Billing Issues remain.
- Billing Recovery Rate (%) — Recovered Conversions / Billing Issues. The value may change while Pending Billing Issues remain.
- Recovered from Grace Period — trials converted from a Grace Period state, regardless of timing and potential future refunds. Also creates a Billing Issue Resolved event.
- Grace Period Recovery Rate (%) — Recovered from Grace Period / total Billing Issues.
- Recovered from Billing Retry — trials converted from a Billing Retry state, regardless of timing and potential future refunds. Also creates a Billing Issue Resolved event.
- Billing Retry Recovery Rate (%) — Recovered from Billing Retry / total Billing Issues.
- Pending Billing Issues — trials still in Grace Period or Billing Retry with auto-renew on.
- Converted with Promo Offer (iOS only) — converted via Promo Offer.
- Converted with Different Product (iOS only) — converted with a product switch (upgrade / downgrade / crossgrade).
Use CasesHow badly the subscription price fits a specific user audience?
Billing Issue Rate may vary by product price and country. A higher Billing Issue Rate corresponds to a lower On-Time Conversion Rate, reflecting worse alignment between pricing and user affordability.How effectively trials recover after a billing issue?
Billing Recovery Rate helps estimate potential revenue from recovered subscriptions; it varies by product price and country.How effectively promotional offers recover failed conversions?
Converted with Promo Offer success depends heavily on the specific offer — better offers lead to higher conversions. Interpret it as the number of successful win-backs.How often users switch plan in iOS settings during billing issues?
Some users, instead of canceling, switch to a cheaper plan (yearly → monthly) or a better-value plan (weekly → yearly). Converted with Different Product can be read as successful win-backs among users who initially intended to cancel.
Cancellations
- Total Cancellations — all trial cancellations, including reversals from re-subscription.
- User Initiated Cancellations — cancellations initiated by users before period end. Reversals are excluded.
- Canceled from Billing Issues — cancellations during any Billing Issue state (auto-renew turned off by the system or user during Grace Period or Billing Retry). The value may change while Pending Billing Issues remain.
- Canceled from Grace Period — cancellations during a Grace Period state. Most likely auto-renew was turned off by the user. The value may change while Pending Billing Issues remain.
- Canceled from Billing Retry — cancellations during a Billing Retry state (auto-renew turned off by the system or user). The value may change while Pending Billing Issues remain.
Use CasesHow often users manually cancel before the trial ends?
User Initiated Cancellations — only the last cancellation event per canceled trial is counted.How many billing issues failed to recover?
Canceled from Billing Issues helps estimate revenue lost to unrecovered billing failures.
Timing
- Average Time to User Cancellation — average hours between trial start and user-initiated cancellation.
- 50th Percentile (Median) Time to User Cancellation — median hours to user cancellation.
- 70th Percentile Time to User Cancellation — 70th-percentile hours to user cancellation.
Use CaseHow quickly half of your users cancel their trial?
The 50th Percentile (Median) Time to User Cancellation shows the point at which half of trial cancellations occur. Subscriptions still active after 1 hour generate atrial_activeevent, which you can use to target users who don't cancel too quickly. Learn more.
Trial Active event timingThe
trial_activeSDK event fires by default 1 hour after trial start. The 50th/70th percentile metrics here can inform whether 1 hour is the right threshold for your app. The delay is configurable on Pro/Expert/Enterprise plans — see Trial Active.
Supported filters and segments
Free Trials Performance supports all standard segments and filters documented in Reports → Filters and segments. The most useful segments are Product and Store Country.
"Created at" segment applies to renewal attempts (trials)Same caveat as on Renewals Performance — "Created on..." segments apply to trial date, not user creation date.
Filter-only (not available as Segment by):
- Permission group — segment support is planned, currently filter only.
- Screen
- Experiment variations
Learn moreSee Free Trials Performance in context in our product update.
FAQ
What's the difference between Day 0 Trials and Session 0 Trials?
- Day 0 Trials uses install date as the anchor: trials within 24 hours of install.
- Session 0 Trials uses first launch date as the anchor and is estimated (counts trials in the first 30 minutes after launch). Session boundaries aren't tracked directly.
If a user installs and doesn't open the app for two days, then opens it and immediately buys a trial, that trial is not Day 0 (it's outside the 24-hour install window) but it is Session 0.
Why are Total Trial Conversions higher than On-Time Conversions?
Because Total includes trials that converted after a billing-issue recovery. On-Time only counts those that converted cleanly at trial end. The difference = Recovered Conversions.
What's a "reversed cancellation"?
A user who cancels their trial but then re-enables auto-renew before trial end. Total Cancellations counts the reversed event. User Initiated Cancellations excludes reversals to give a "real" cancellation count.
Updated about 1 month ago