
Cohort Revenue
Revenue generated by users grouped by install date, with Sales or Proceeds calculation.
Renamed in 2.0This chart was previously called Cohort Proceeds. The slug
cohort-proceedsis unchanged.
Cohort Revenue is a cohort chart that shows the revenue generated by users who installed the app within the specified dates.
For example, if the chart shows $2,500 for June 4, it means users who installed on June 4 collectively generated $2,500 in revenue. As time passes, each cohort's revenue continues to grow with renewals and additional purchases (and can also shift due to refunds).
Find Cohort Revenue under Analytics → Reports → Money in the sidebar.
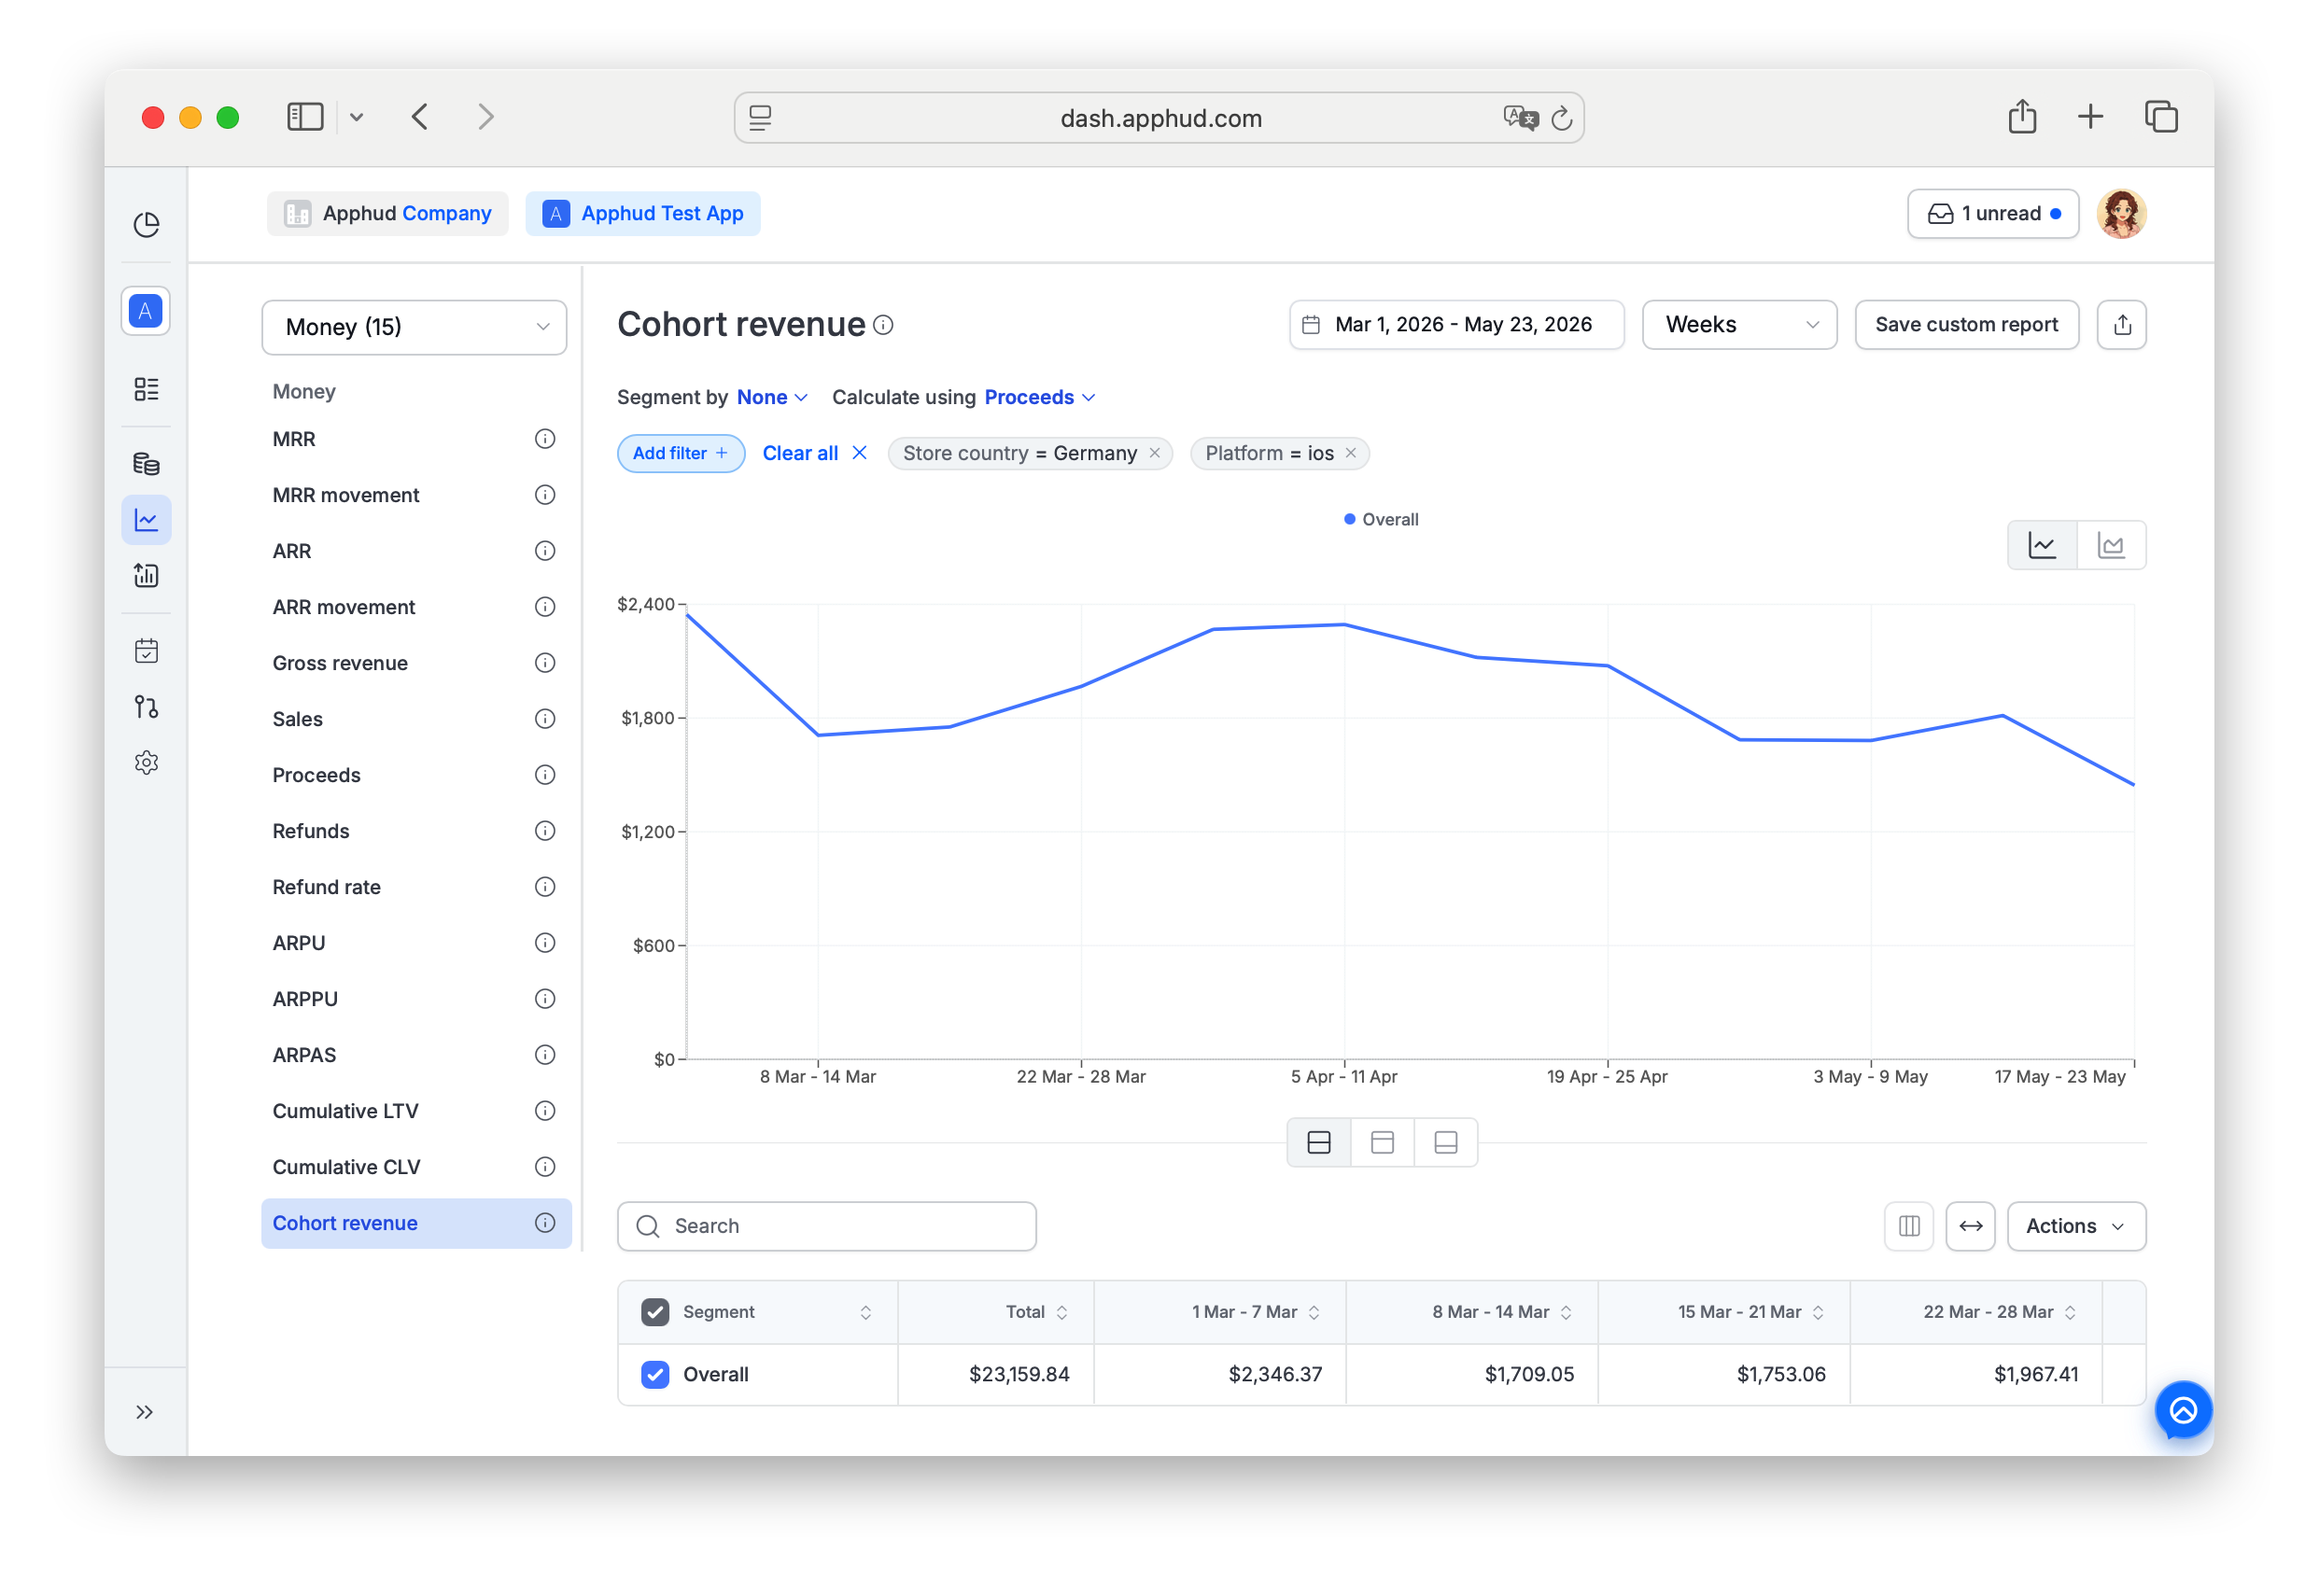
Chart-specific parameters
Calculate using
- Proceeds (default) — revenue after refunds, store commissions, and VAT.
- Sales — revenue after refunds, before commissions and VAT.
Switches the metric the chart sums per cohort. See Proceeds and Sales.
What's counted
The chart counts all purchases by users in each install-date cohort — not just subscriptions:
- First-time subscription purchases
- Subscription renewals
- Intro / promo offer purchases
- Non-renewing purchases (consumables, lifetime unlocks, etc.)
- Refunds (subtracted) when Proceeds metrics is chosen.
The x-axis is the cohort timeline (date users installed), not the event timeline. Revenue posted on June 4 belongs to the cohort of users who installed on June 4 — regardless of when the actual transactions occurred.
Supported filters and segments
Cohort Revenue supports all standard segments and filters documented in Reports → Filters and segments.
Filter-only (not available as Segment by):
- Permission group — segment support is planned, currently filter only.
- Screen
- Experiment variations
FAQ
What's the difference between Cohort Revenue and Proceeds?
- Proceeds plots revenue on the transaction date — a renewal on Day 200 of a user's life shows up on the day it occurred.
- Cohort Revenue plots revenue on the install date of the user — a renewal on Day 200 shows up on the cohort's install date, not on the renewal date.
Use Proceeds for "what was my revenue last month"; use Cohort Revenue for "how much have last month's installs earned us so far".
Why do historical cohort values keep changing?
Because each cohort keeps generating revenue over time:
- Subscription renewals — cohort revenue grows as users keep renewing.
- New purchases — additional one-time or subscription purchases after install also add to the cohort.
- Refunds — subtract from the cohort's total.
- Late data ingestion — if data migration wasn't performed when integrating the SDK, historical purchases may arrive late and retroactively boost old cohorts. See Proceeds → Why might historical proceeds change?.
What does each x-axis tick mean — when the user installed or when the transaction happened?
The x-axis is when the cohort installed. Each tick aggregates all revenue ever generated by users who installed on that date, regardless of when their individual transactions occurred.
Should I use Proceeds or Sales for Cohort Revenue?
- Proceeds — for analyzing the cash you actually keep from each cohort (after store commission and VAT). Best for ROI vs. CPI comparisons.
- Sales — for analyzing the gross billing each cohort produced (after refunds, before commission and VAT). Useful when comparing to store-side billing reports.
Updated 18 days ago