
Events Report
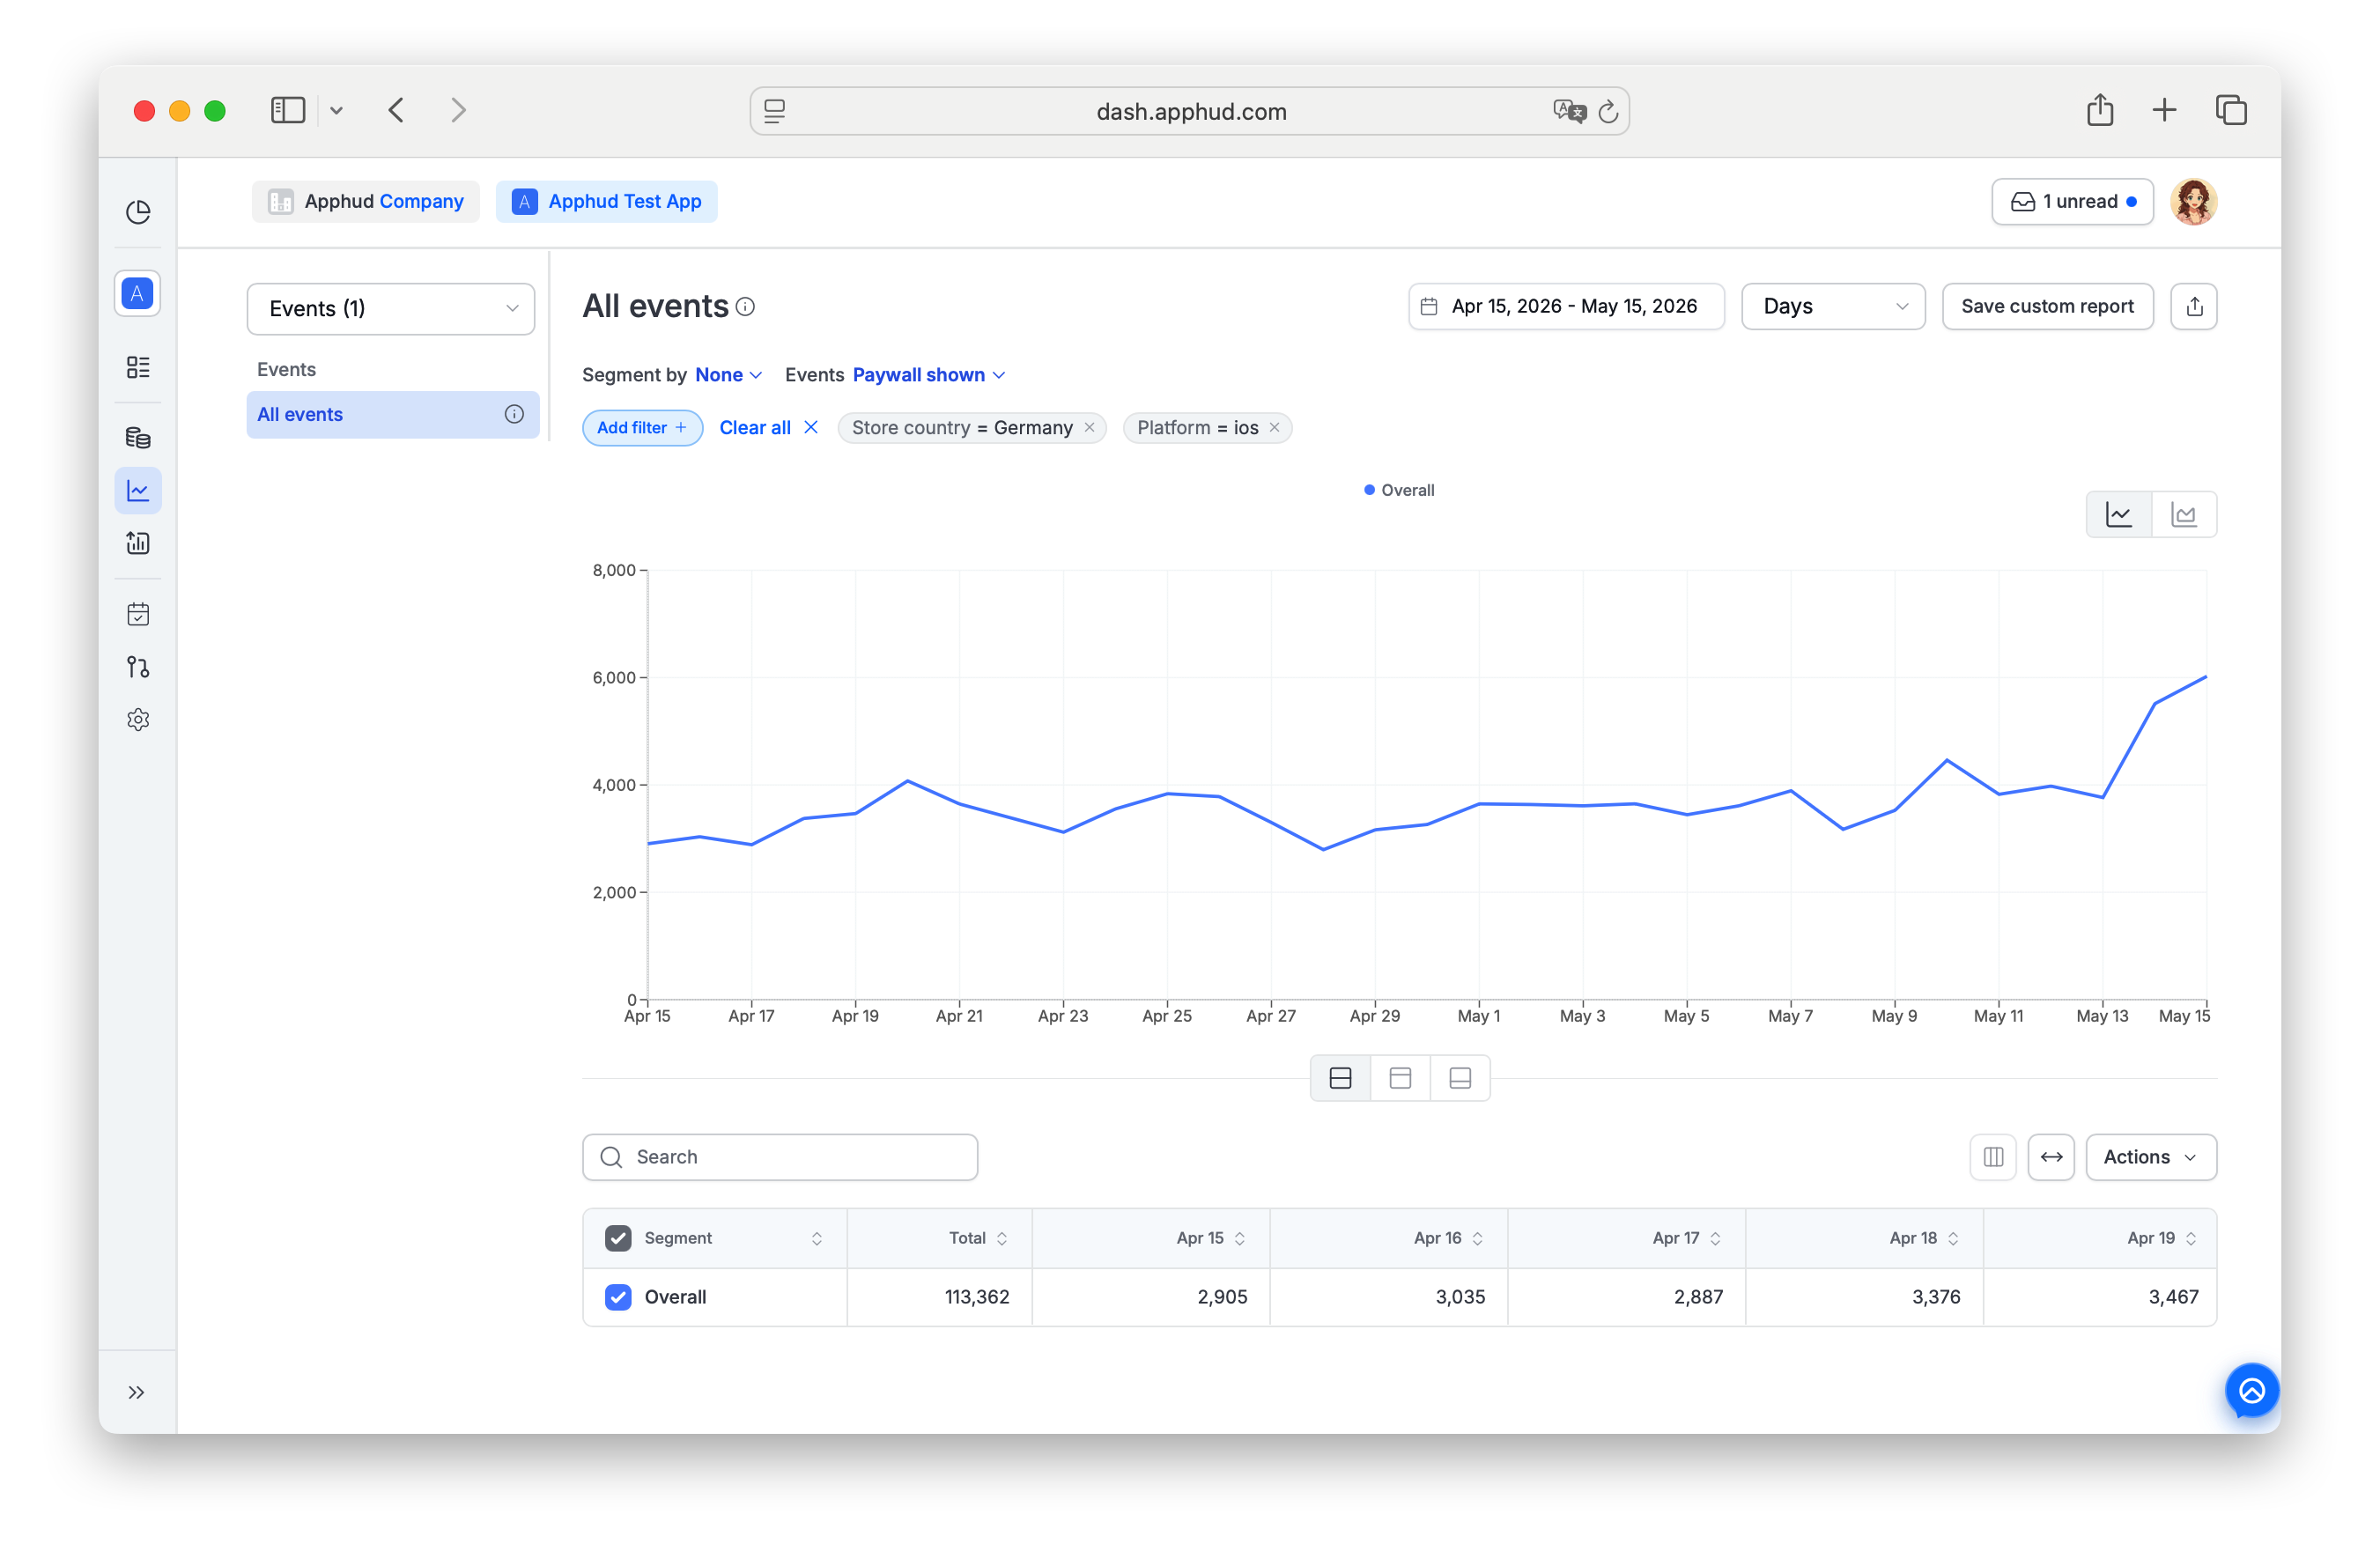
Non-cohort chart showing counts of subscription, paywall, and other events over time.
Events Chart is a non-cohort chart that shows the count of specific events occurring within the selected dates.
It's distinct from the Events page — the Events page is a granular row-by-row log of individual events with integration delivery status; this chart aggregates event counts over a time series.
Find Events Chart under Analytics → Reports → Events in the sidebar.
Events included
Pick which events to chart from the Events dropdown. All events from Apphud's catalog can be included — see Event Types for the full reference.
Common groupings:
Trial subscription events
- Trial started
- Trial expired
- Trial converted
- Trial cancelled
Regular subscription events
- Subscription started
- Subscription renewed
- Subscription cancelled
- Subscription expired
- Subscription refunded
Introductory offer events
- Intro started
- Intro renewed
- Intro converted
- Intro expired
- Intro refunded
Promotional offer events
- Promo started
- Promo renewed
- Promo converted
- Promo expired
- Promo refunded
Non-renewing purchase events
- Non-renewing purchase
- Non-renewing purchase refunded
Paywall events
- Paywall shown
- Paywall closed
- Paywall checkout initiated
- Paywall payment cancelled
- Paywall payment error
Other events
- Autorenew enabled
- Billing issue
- App reinstalled
For the full list and per-event definitions, see Event Types.
Supported filters and segments
Events Chart supports all standard segments and filters documented in Reports → Filters and segments.
Filter-only (not available as Segment by):
- Permission group — segment support is planned, currently filter only.
- Screen
- Experiment variations
Paywall Error Reason
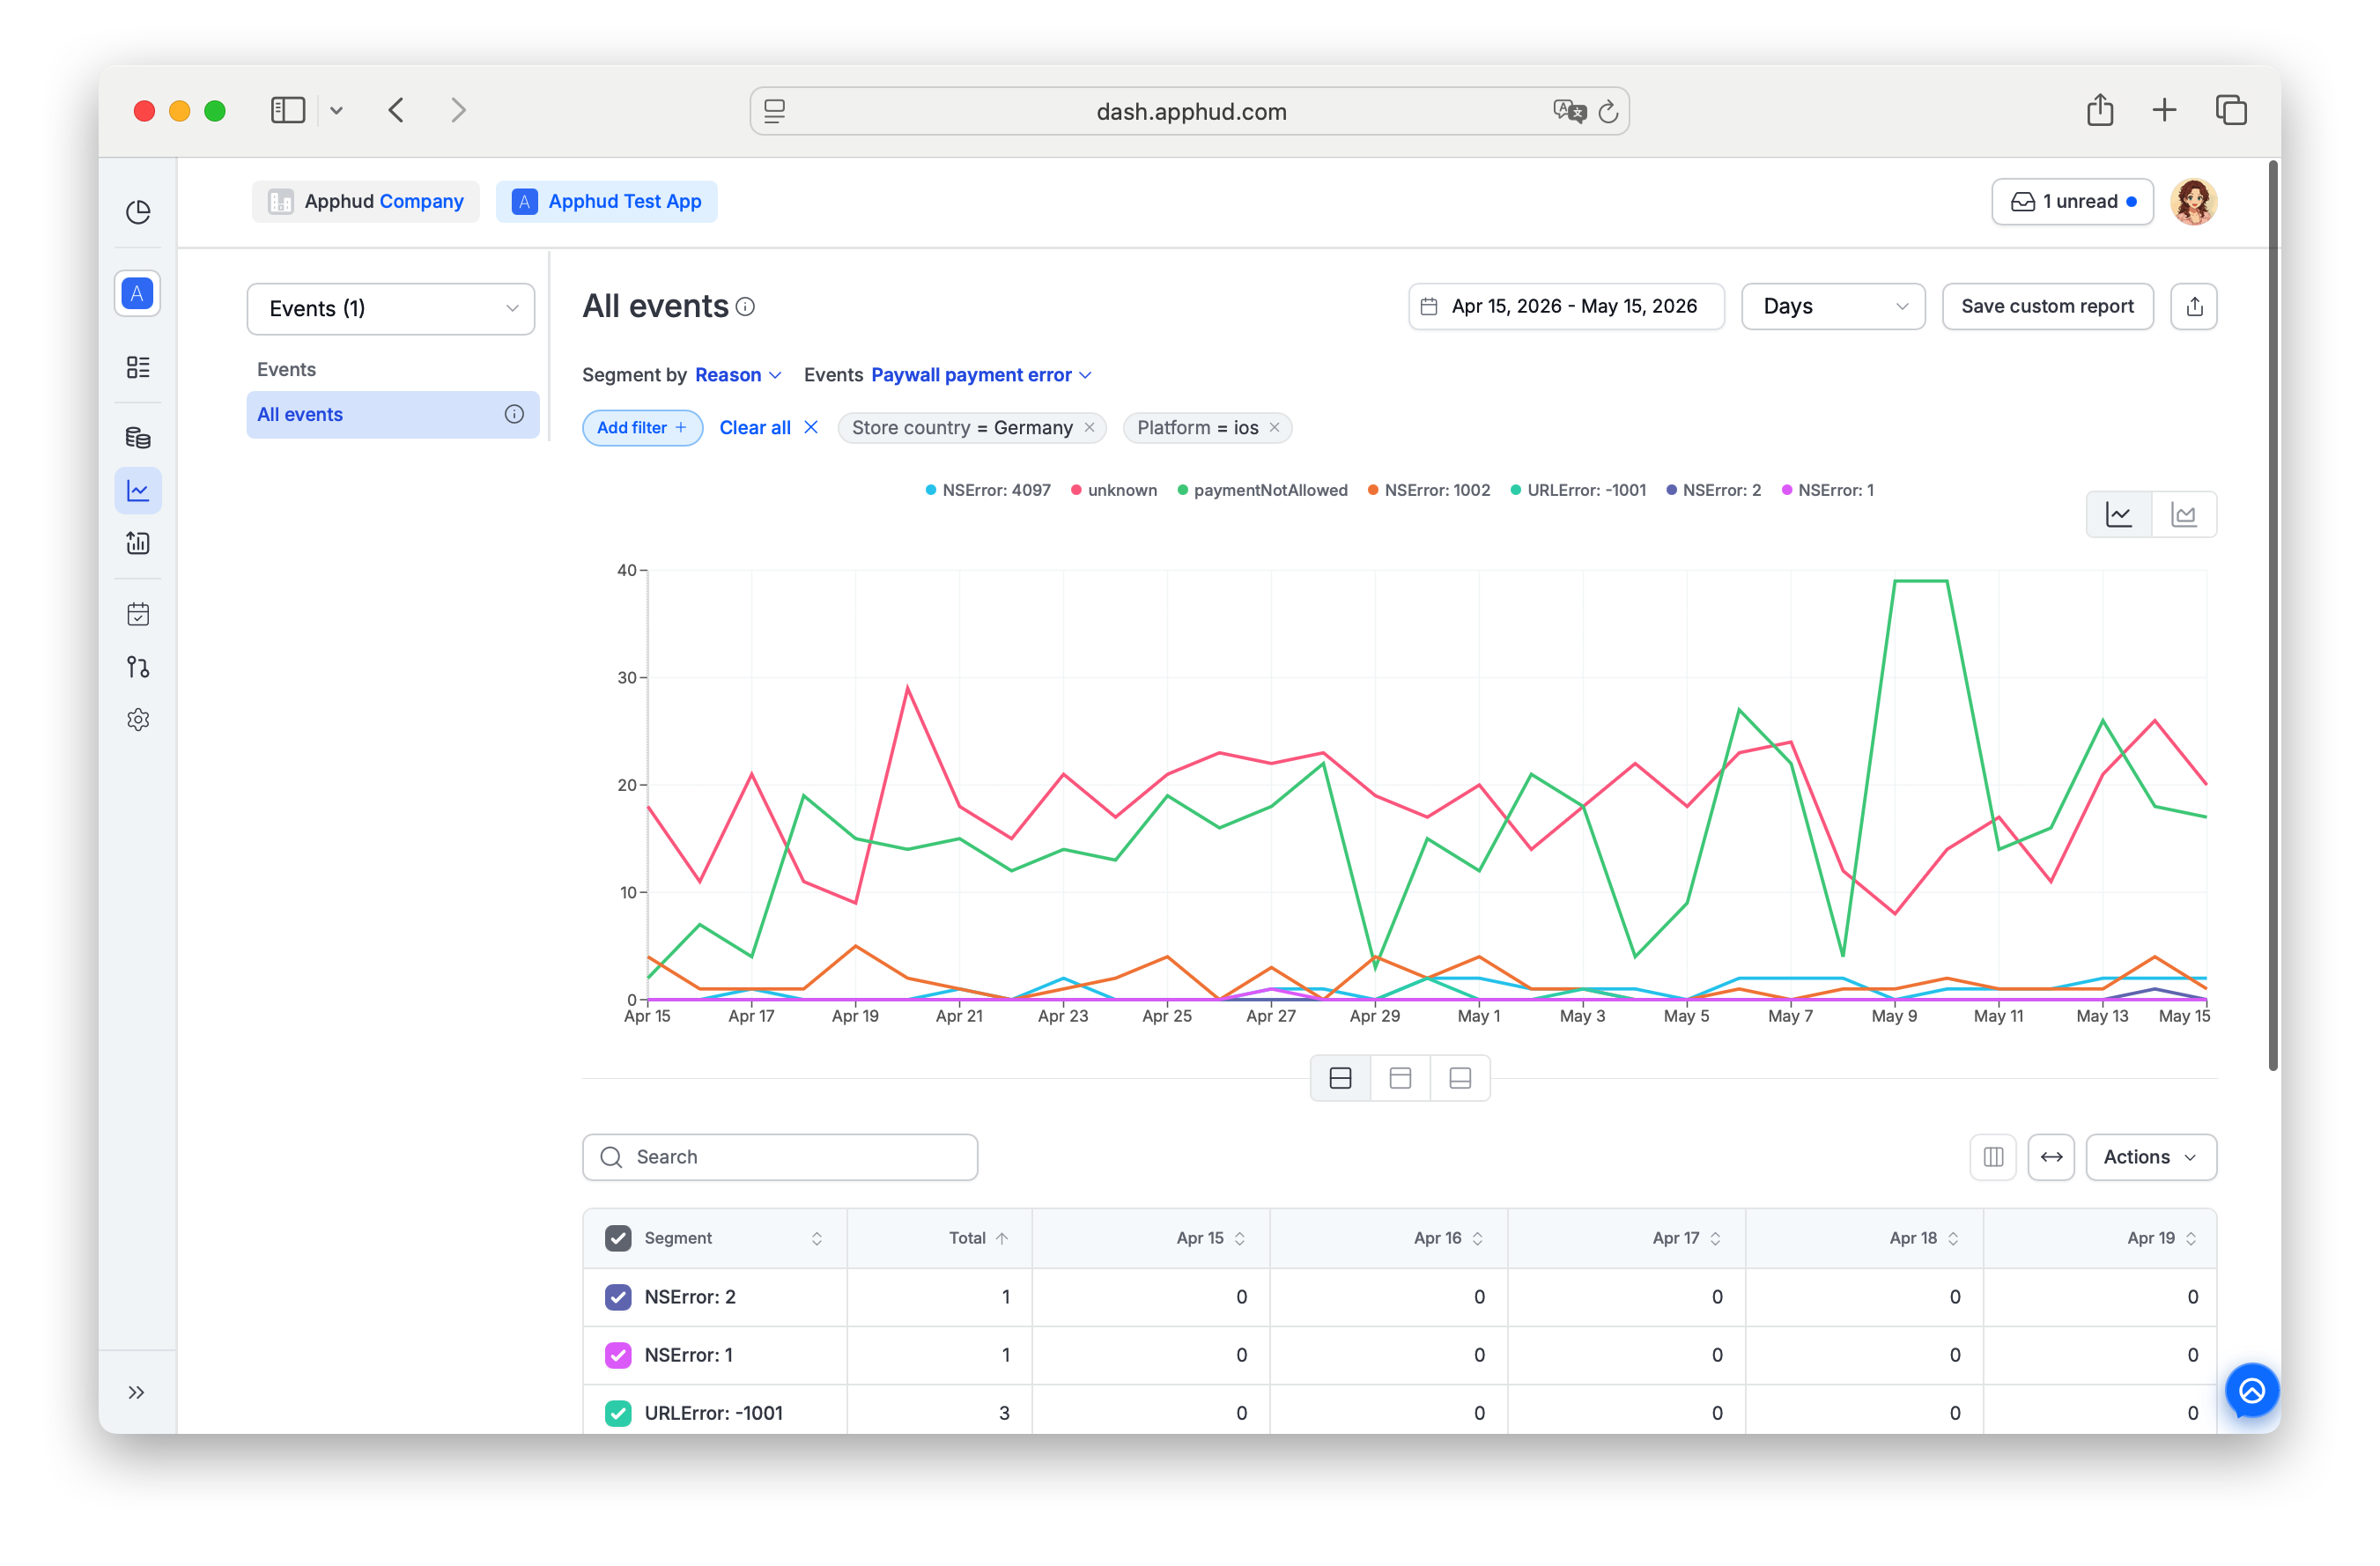
With paywall payment error, the Reason segment becomes available. It shows the store error returned during a failed purchase attempt (for example, SKErrorDomain Code=1 clientInvalid from StoreKit or BILLING_UNAVAILABLE from Google Play Billing). Use this segment to analyze failure patterns and identify whether issues are related to user restrictions, connectivity, store availability, or app configuration.
FAQ
What's the difference between Events Chart and the Events page?
| Events Chart | Events page | |
|---|---|---|
| Type | Aggregated time series | Individual event log (table) |
| Lives in | Analytics → Reports → Events | Top-level sidebar |
| Use for | Trends and volume over time | Investigating specific transactions, debugging integration delivery |
For the granular table, see Events. For Apphud's event-type catalog, see Event Types.
Why is this chart non-cohort?
Because each bar / point counts events that occurred in the period, not events from a specific install cohort. A subscription_renewed event on March 15 shows up in March 15's bar regardless of when the user installed.
Are paywall events (Paywall Shown, etc.) always available?
Paywall Shown requires your app to call Apphud.paywallShown() from the SDK. Without that call, the event won't be emitted and won't appear in this chart. See Paywall shown.
Updated 22 days ago