
Common controls
Shared controls — date pickers, filters, refresh, table behavior, sharing, and export — used across Apphud Analytics surfaces.
This page documents the controls shared across Apphud Analytics surfaces: Business Overview, Dashboard, Reports, and Paywall analytics.
For chart-specific UI (Segment by, Granularity, Chart type, Display toggle, Save custom report, etc.), see Reports → Chart controls. For Apphud's overall analytics model (VAT, charge date, First Seen Date, cohort caveats), see About Analytics.
Period (date range)
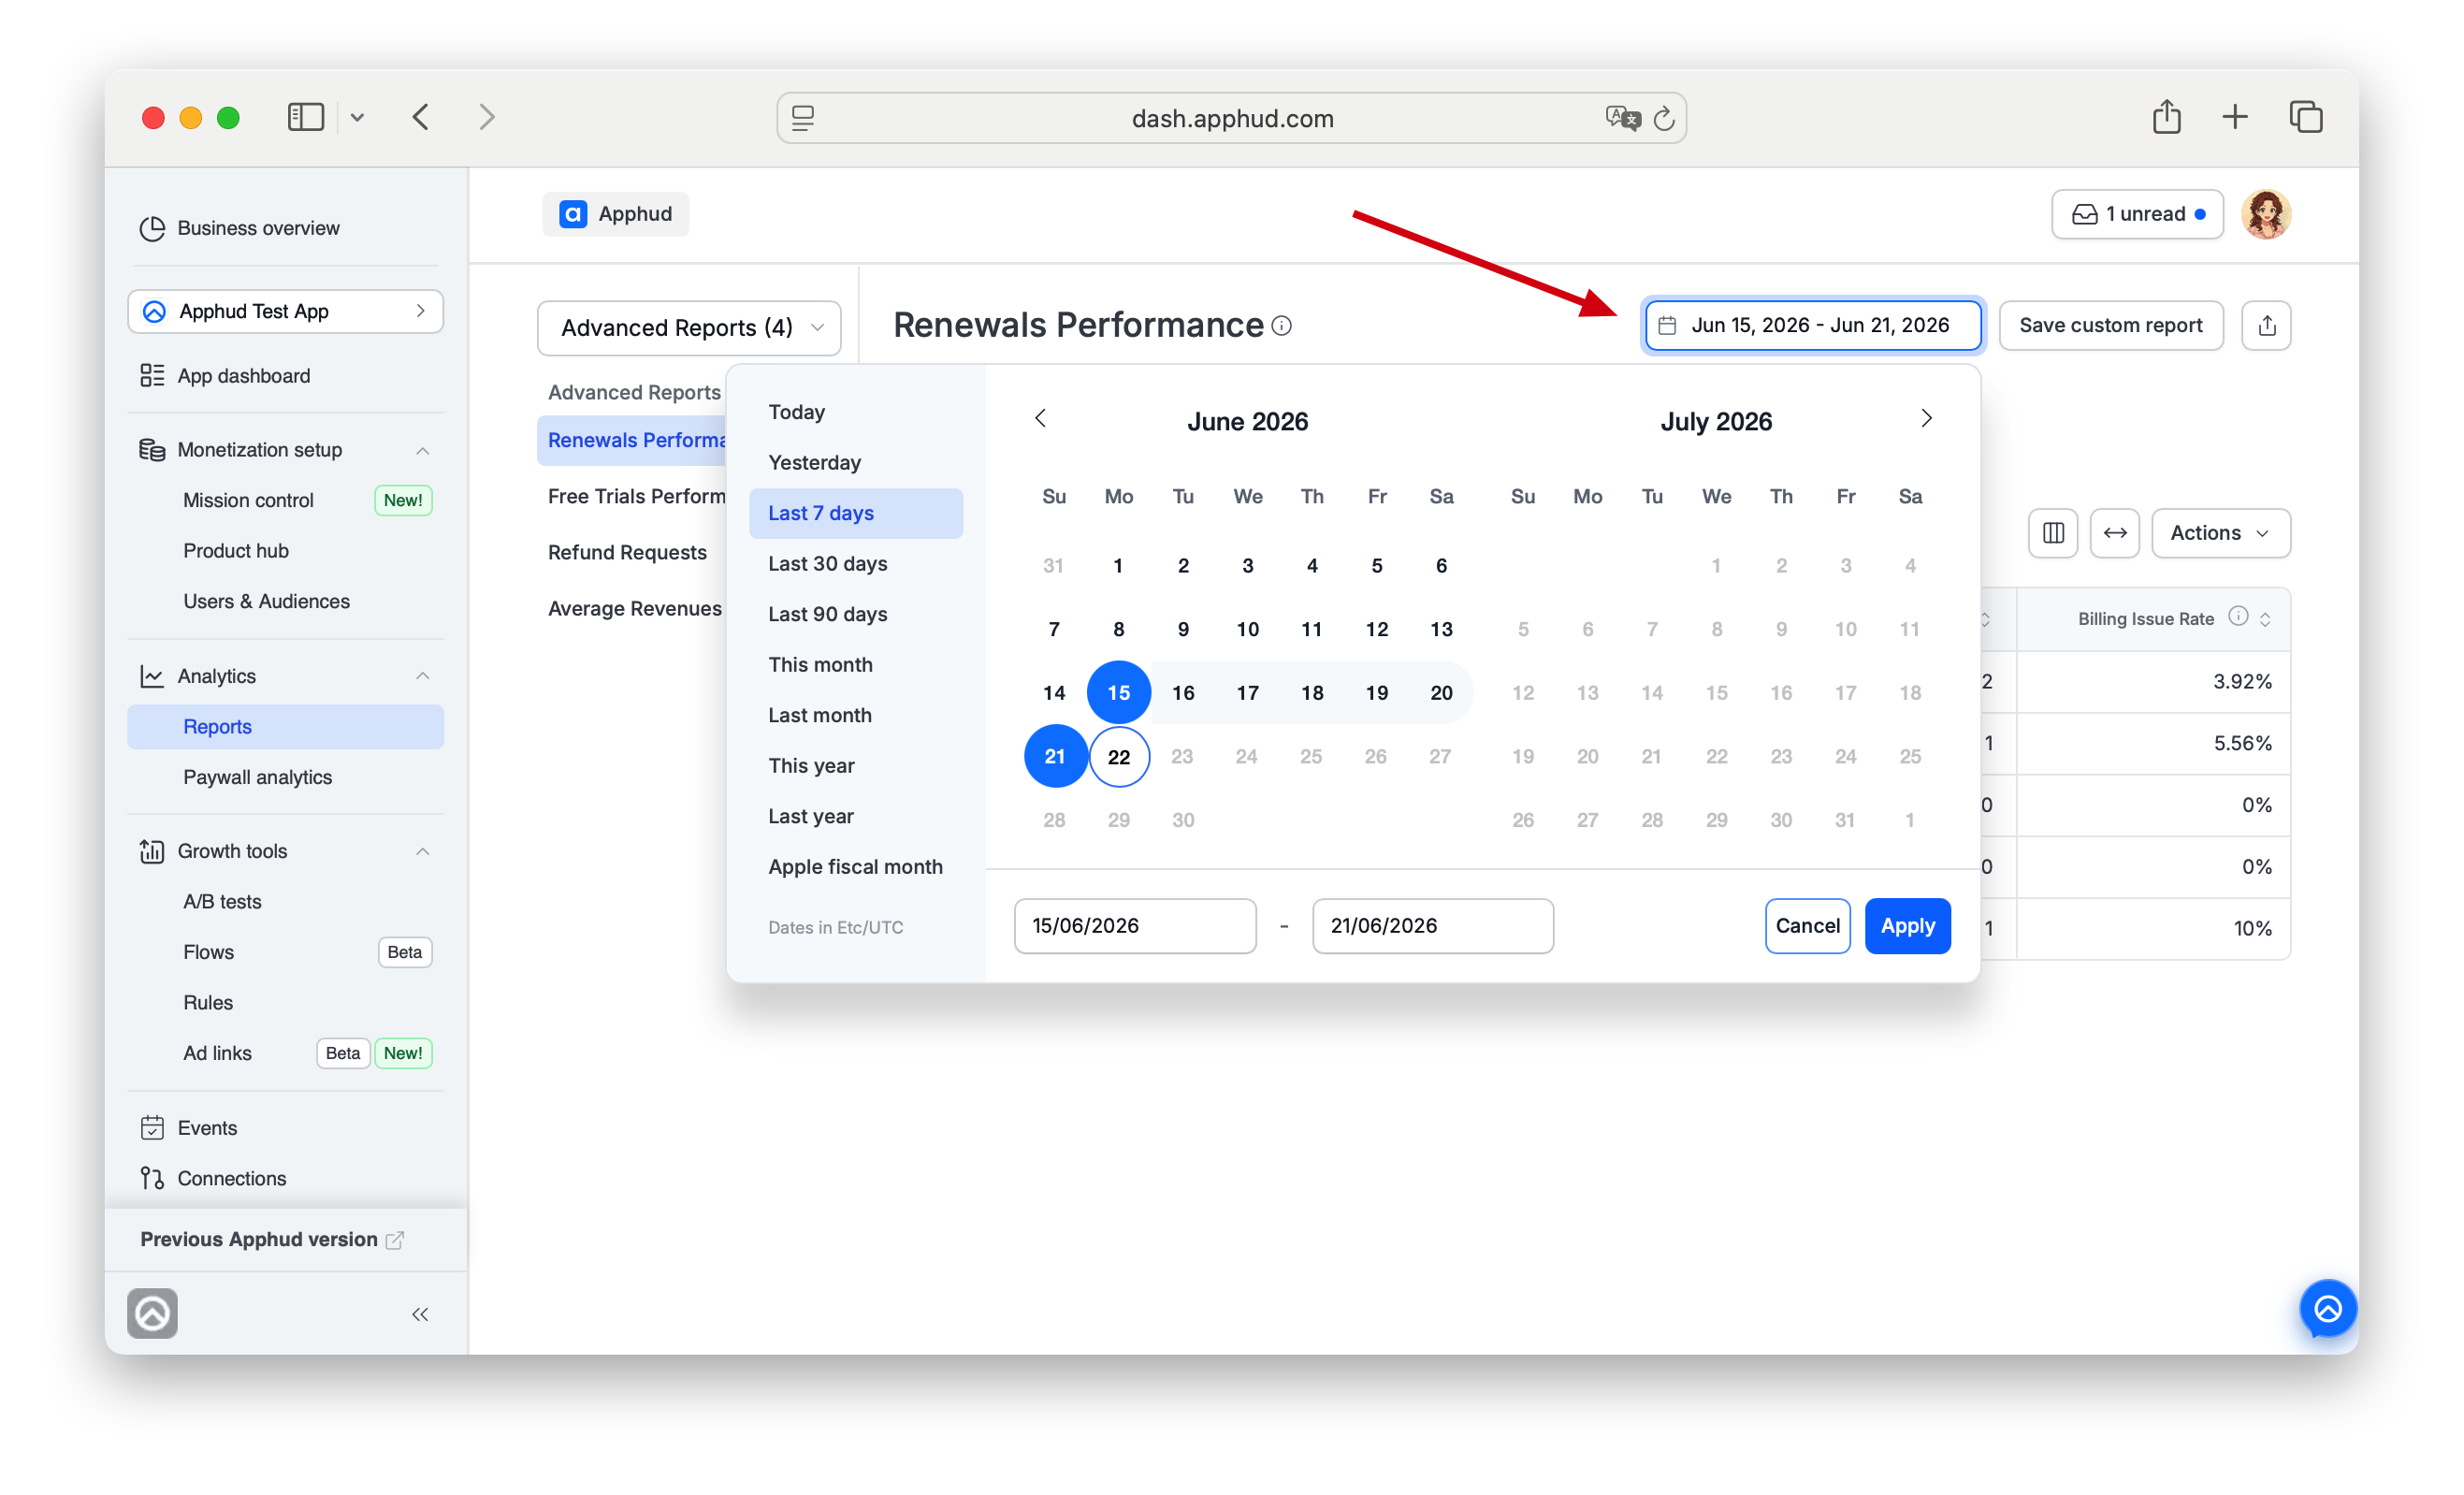
The date range button at the top opens a picker with presets and a two-month calendar. Labels vary by report and depend on a day used to define a period. The picker mechanics are identical everywhere.
Presets
- Today
- Yesterday
- Last 7 days (today is excluded)
- Last 30 days (today is excluded)
- Last 90 days (today is excluded)
- This month
- Last month
- This year
- Last year
- Apple fiscal month (with Current and Previous options)
Pick a preset, drag across two dates in the calendar, or manually enter start and end date and then click Apply.
Timezone
All reports use the timezone configured in your app settings. Date pickers, chart x-axes, and table values follow that timezone.
Exception — Business Overview. Each Business Overview dashboard has its own timezone setting, configured per-dashboard. Different dashboards under the same app can use different timezones — useful for cross-region teams looking at the same data from different perspectives.
What the range scopes
- Business Overview — applies to every widget on the active dashboard that doesn't override the range itself.
- Dashboard — recalculates the KPI and Conversions tabs.
- Reports (chart reports) — defines the time window plotted on the x-axis.
- Paywall analytics — recalculates all metrics for the period.
Filters (Add filter)
Depending on the analytics surface, filters are opened from different places — for example, via Add filter + in chart reports, or as a configuration field on a Business Overview widget — but their purpose is the same everywhere: narrowing down the data you're analyzing.
Filters open a dialog with categories on the left and parameters on the right. Available categories and parameters are surface-specific. For chart-report dimension definitions, see Reports → Filters and segments.
The filter mechanics below are identical across surfaces.
Operators
Filter operators depend on the parameter type:
= (is)and≠ (is not)— equality, available on most parameters.<,>,≤,≥— numeric comparisons, available on numeric parameters like Revenue, App Version, OS Version.
Predefined vs. free-form values
- Predefined values — parameters whose values come from your account configuration (Permission Group, Paywall, Placement, Connections, Product ID, Country, etc.) open a searchable list with checkboxes.
- Free-form values — parameters like App Version, custom numeric thresholds, Campaign names, and User Properties accept typed input.
Multi-select
Parameters that support multi-select (Permission Group, Paywall, Placement, Connections, and similar) show a checkbox list with:
- Select all — picks every value in the list.
- Clear all — unchecks every value.
- A search field at the top to find a value by name.
- An All / Selected toggle to view either the full list or only your current selection.
Click Apply filter to add the filter; the applied filter appears as a chip in the view.
Filter chips
Each applied filter shows as a chip — e.g., Country by IP = United States ×. Click the × on a chip to remove that single filter. Click Clear all × to remove every active filter at once.
Refresh data
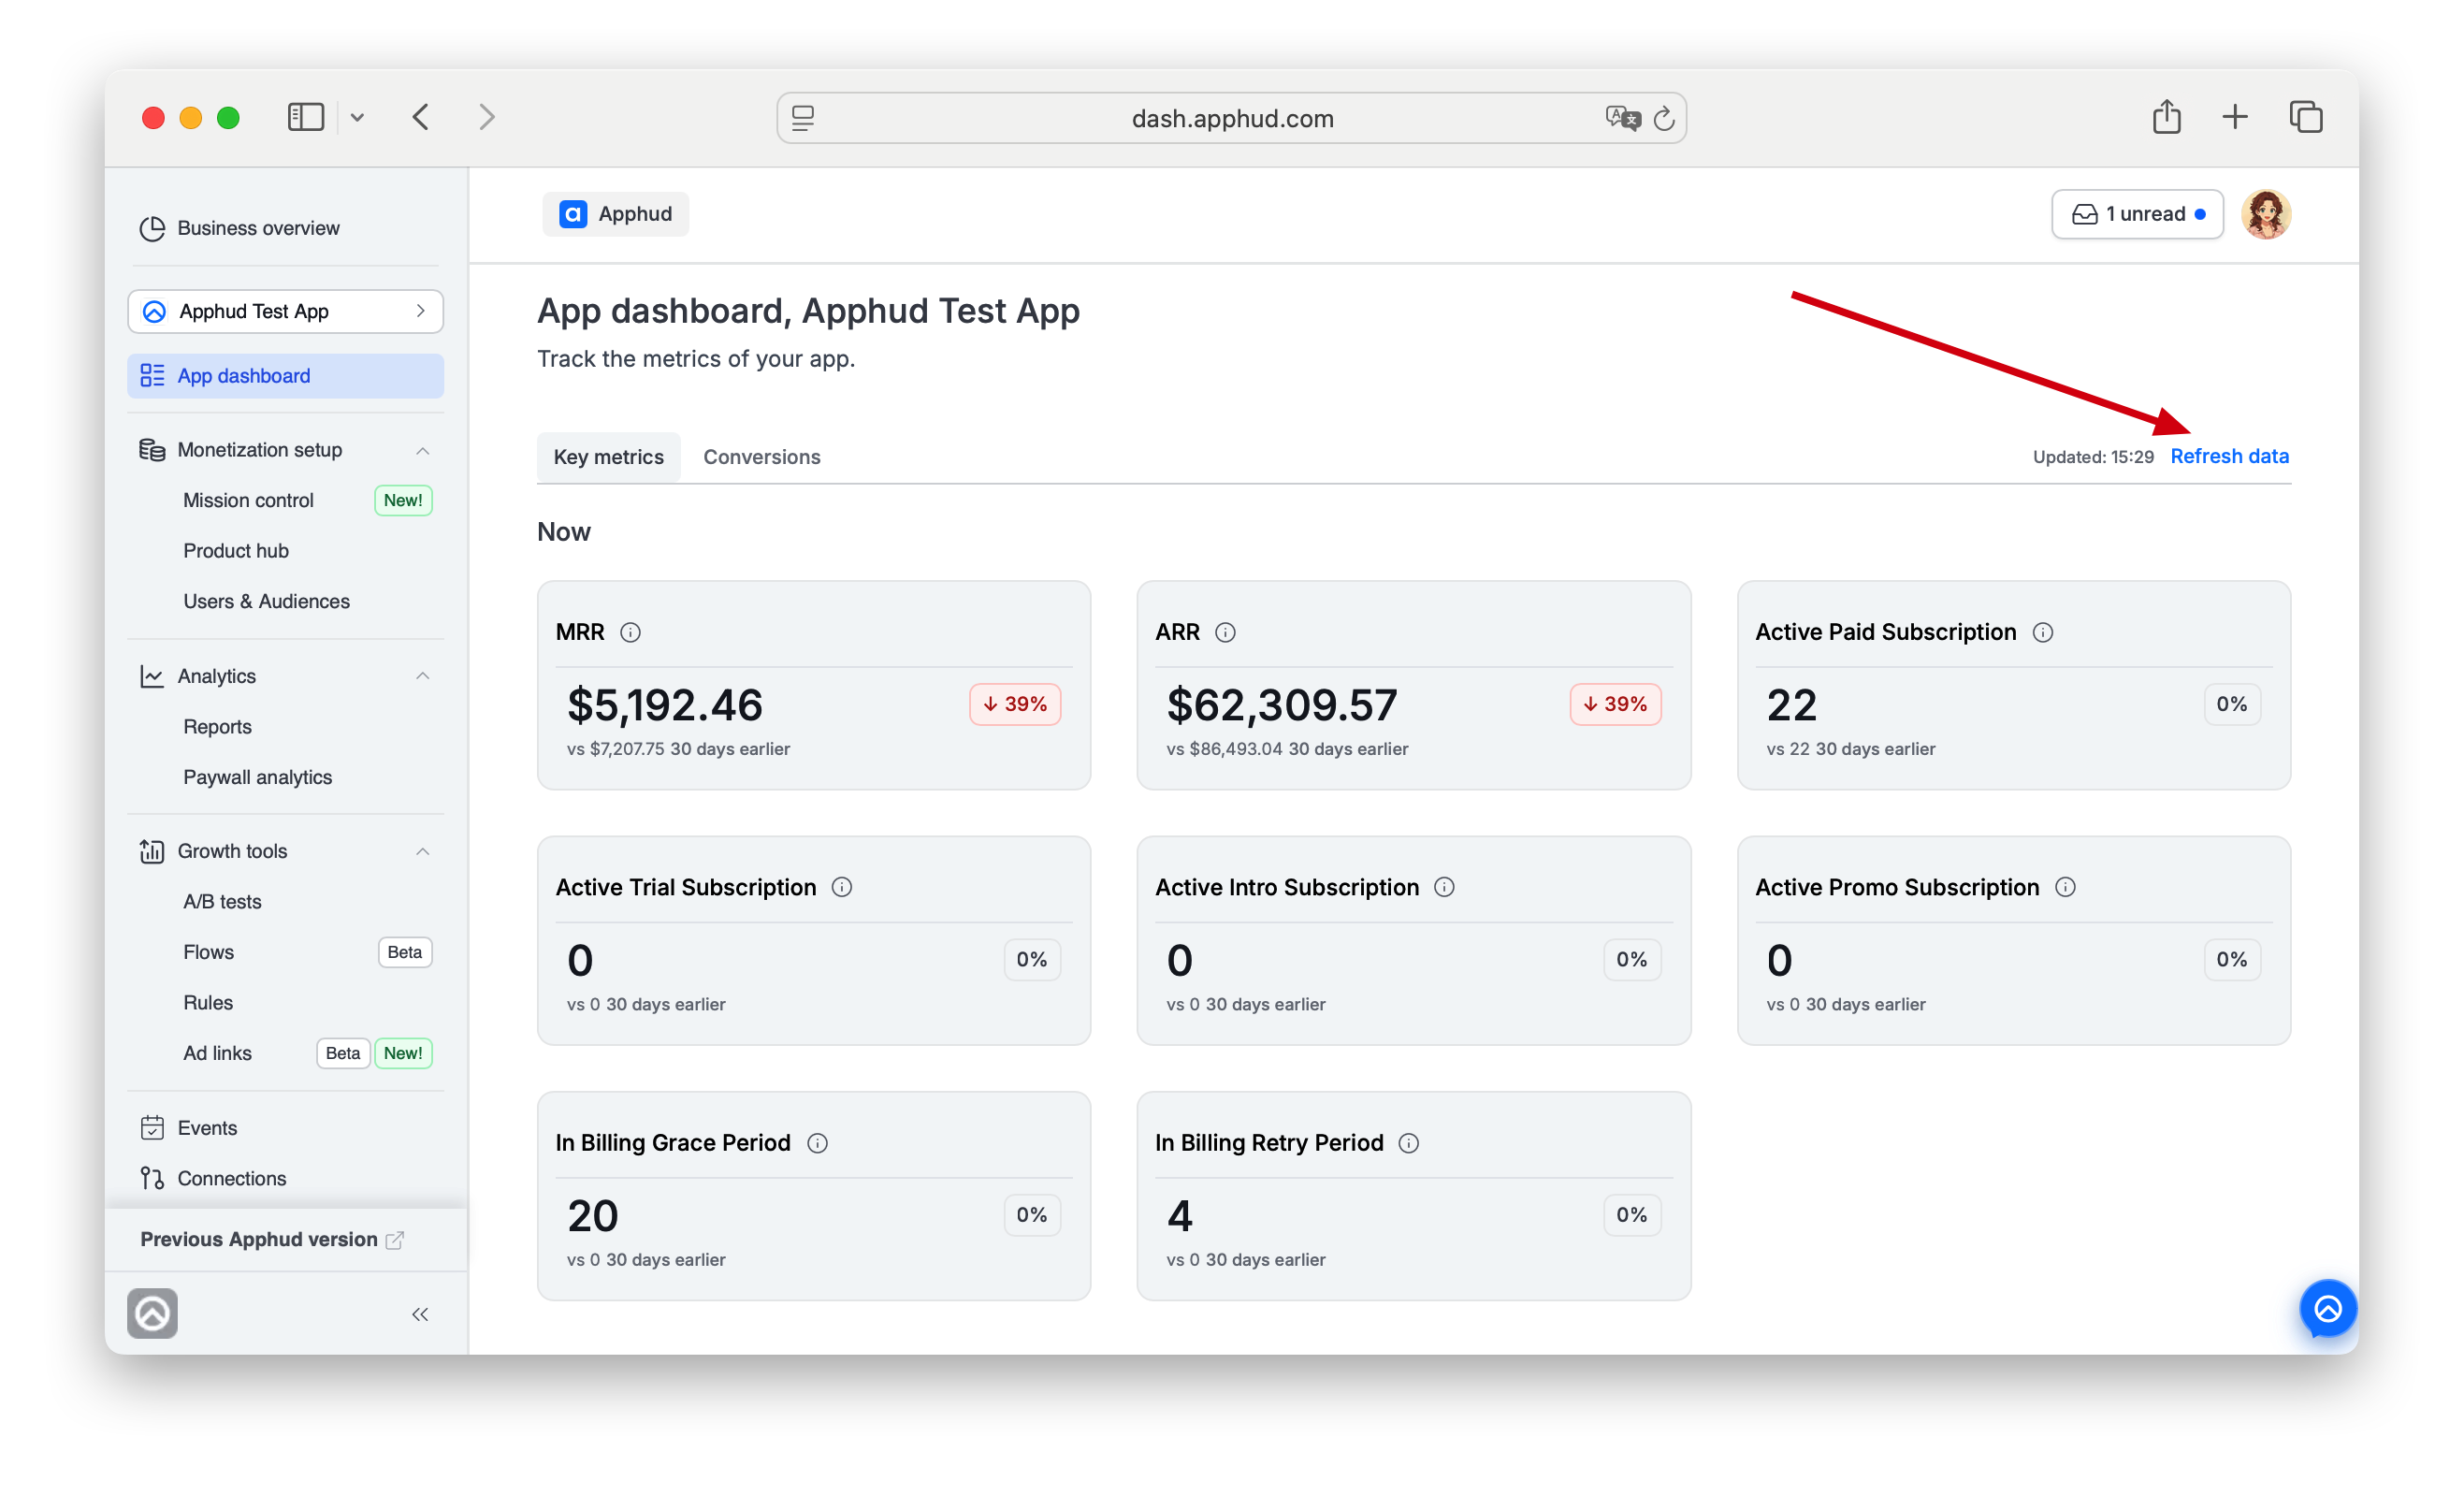
Refresh data button at the top of Business Overview and Dashboard pages reloads the widget numbers updating those with the latest data since the view was opened, without changing your settings like filters, date range.
Reports and Paywall analytics pages do not have such a control.
Controls specific to Reports & Paywall analytics
Some controls exist only on the Reports and Paywall analytics surfaces and are documented on the Reports page.
Updated 30 days ago