
Paywall Analytics
Track sales, proceeds, trials, purchases, and conversion rates for each paywall and placement.
Paywall analytics reports how your paywalls and placements perform — sales, proceeds, trials, purchases, and conversion rates — over a selected date range. Find it in the sidebar under Analytics → Paywall analytics.
It has two tabs with identical metrics, grouped differently. The Segment column shows the name of the paywall or placement for the active tab.
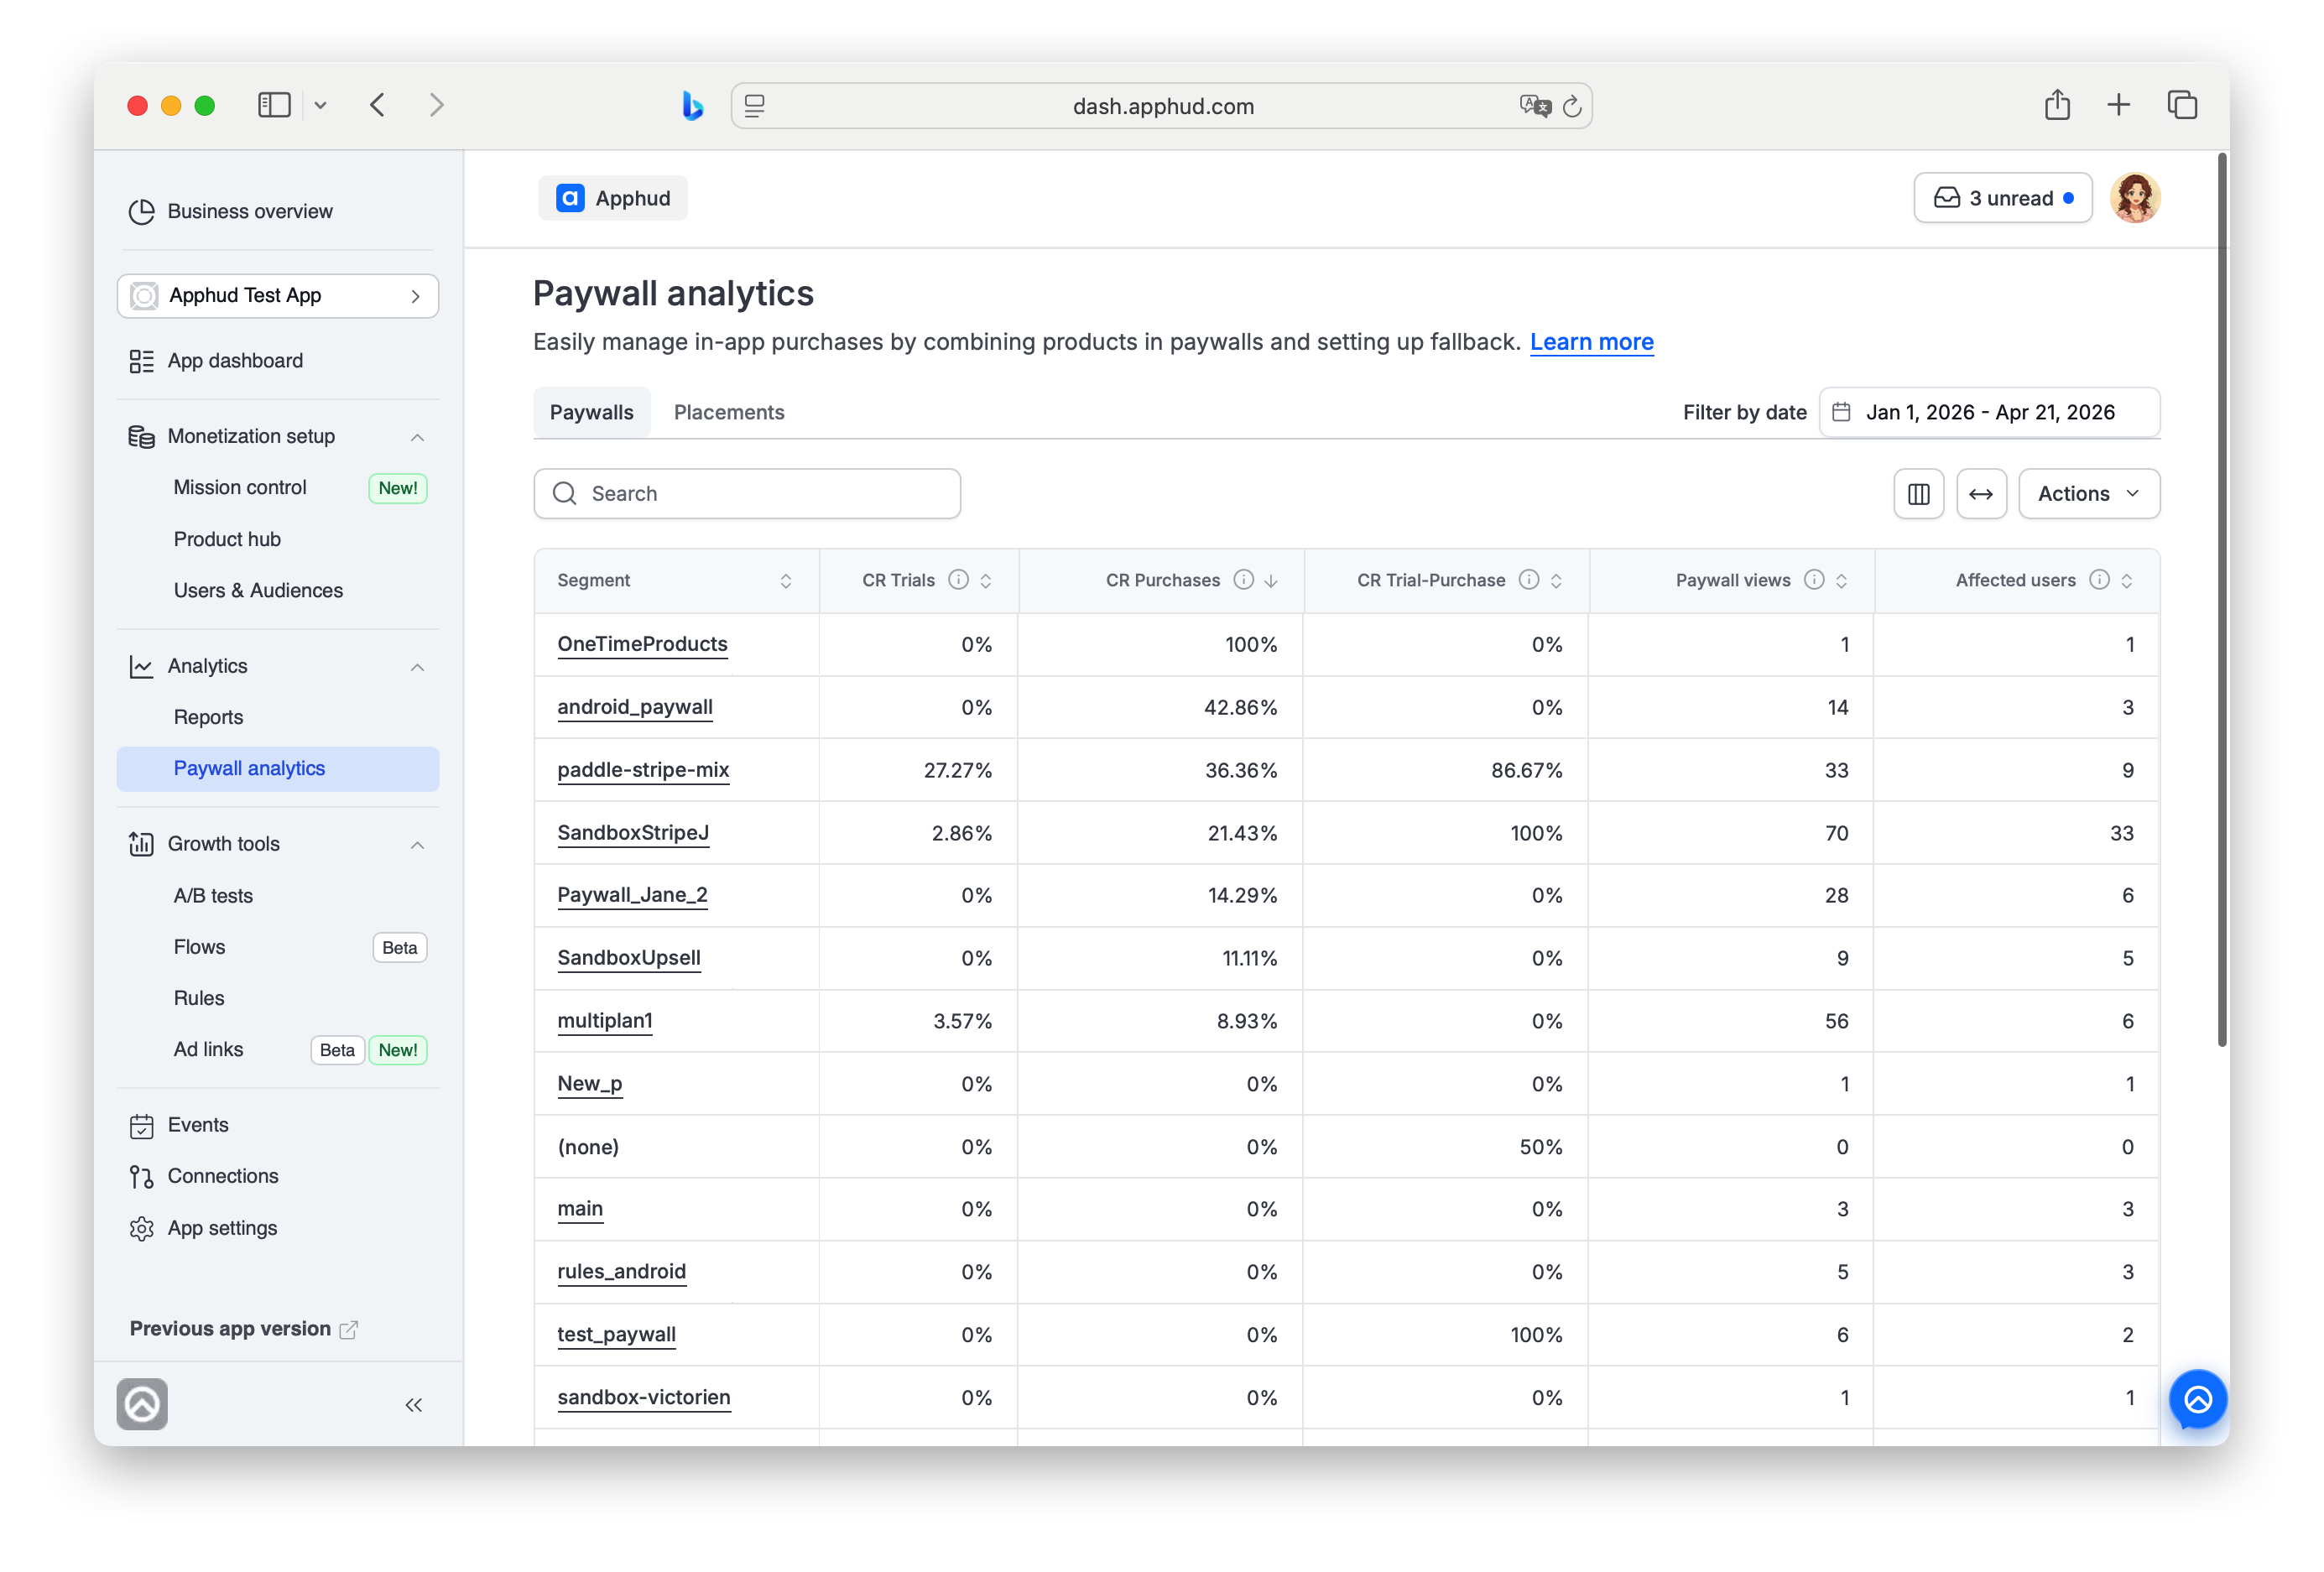
Paywalls and Placements tabs
- Paywalls — one row per paywall.
- Placements — one row per placement.
Both tabs use the same metrics and the same date filter. Switch tabs to change only how data rows are grouped.
Date range
Use Filter by date to set the reporting period (for example, Jan 1, 2026 – Apr 21, 2026). All metrics are recalculated for the selected period. The applied customization is kept on the tabs switch.
On the Paywalls and Placements tabs, date is the only filter: filters and segmentation aren't available while you look at all paywalls or all placements. They become available in the report of a single paywall or placement — see below.
Report for a single paywall or placement
Open the report of one paywall or placement in one of two ways:
- In Paywall analytics, click its name in the table on the Paywalls or Placements tab.
- In Mission Control → Paywalls, click View all analytics on the paywall's card.
The page shows the same metrics for that paywall or placement only, and adds three controls:
- Segment by — split the table into segments.
- Cohort period — choose the cohort period; the default is 365 days.
- Add filter — narrow the data by user, device, attribution and other filters. See Reports → Filters and segments.
Metrics
Every metric counts only activity attributed to the segment in that row — the specific paywall or placement.
Monetary values reflect your store(s) and tax settings.
| Metric | Definition |
|---|---|
| Sales | Total amount billed to customers, including renewals. |
| Proceeds | The estimated revenue you receive after taxes and store commission. |
| Trials | Number of Trial Started events. |
| Purchases | Number of paid events, excluding renewals — Subscription Started, Trial Converted, and Non-Renewing Purchase. |
| Refunds | Amount of money refunded to users. |
| Refund rate | Share of transactions fully refunded during the period. |
| ARPPU | Average proceeds per paying user, including renewals. |
| ARPAS | Average proceeds per paying user or free-trial subscriber. |
| CR Trials | Conversion from a paywall view to a free trial. |
| CR Purchases | Conversion from a paywall view to a paid purchase, excluding trials and renewals. |
| CR Trial-Purchase | Conversion from a free trial to a paid subscription. |
| Paywall views | Number of paywall views. |
| Affected users | Number of unique users who viewed the paywall. |
Four conversion metrics need the Paywall Shown SDK eventPaywall views, Affected users, CR Trials, and CR Purchases depend on your app sending the
Paywall Shownevent from the SDK. Without it they will show N/A.Send
Paywall Shownwhenever a paywall is displayed to get accurate view counts and conversion rates.Note that even if the event is sent, N/A will be shown for the conversion metrics when there are no paywall views for the selected paywall or placement in the selected date range. In this case there is no denominator for the conversion-rate calculation, so the value is intentionally not shown as
0%.
Table tools
The table supports sorting (click a column header), choosing which columns are shown, horizontal scrolling, and Actions → Copy table data, which copies the selected rows to your clipboard.
The table controls here — column selection, sort, frozen header, Share URL, and Copy / Export — work the same as on chart reports. For the full description see Reports → Table controls, Share URL and Actions menu.
FAQ
Why do Paywall views and Affected users show N/A for any data period?
Your app isn't sending the Paywall Shown event. Both metrics are counted from that event; without it they display N/A. See the callout under Metrics.
Do these numbers include renewals?
Majority of metrics like Sales, ARPPU, etc. include renewals. The exception is Purchases - it counts initial paid events only (Subscription Started, Trial Converted, Non-Renewing Purchase) and excludes subsequent renewals.
Updated 11 days ago